
UPDATES: September 2014

UPDATES is an email newsletter on stormwater management, assessment (including monitoring), and maintenance research at St. Anthony Falls Laboratory and the University of Minnesota.
UPDATES is a monthly email newsletter on stormwater management, assessment (including monitoring), and maintenance research at St. Anthony Falls Laboratory and the University of Minnesota.
Click HERE to subscribe to UPDATES Newsletter
Or Text SWUPDATES to 22828 to Join. Message and data rates may apply.
For Email Marketing you can trust
Infiltration in Roadside Swales/ Drainage Ditches
September 2014 (volume 9 - issue 3)
Contributed by Farzana Ahmed, PhD Candidate, St. Anthony Falls Laboratory, Department of Civil, Environmental and Geo-Engineering, University of Minnesota; John Gulliver, Professor, Department of Civil, Environmental and Geo-Engineering, University of Minnesota; and John Nieber, Professor, Department of Bioproducts and Biosystems Engineering, University of Minnesota.
Funded by the Minnesota Department of Transportation (MnDOT), Minnesota Local Road Research Board (LRRB).
Introduction
Grassed swales are shallow, flat-bottomed, open vegetated channels that are designed to convey, filter and infiltrate stormwater runoff (Barrett et al., 1998a; Deletic and Fletcher, 2005). They are often employed along highways, where highway medians and roadside drainage ditches may essentially act as grassed swales (Barrett et al., 1998a; 1998b). They have the capability to reduce runoff volume and improve water quality. Volume reduction occurs primarily through infiltration into the soil, either as the water flows over the slide slope perpendicular to the roadway into the swale or down the length of the swale parallel to the roadway. Because of wide variability of infiltration rates, even within a single swale, multiple measurements should be made (Asleson et al., 2009). A new method of measuring infiltration capacity has recently been developed (Asleson et al. 2009; Olsen et al. 2013: Paus et al. 2014; Ahmed et al., 2014), where a rapid infiltration technique allows multiple measurements to be taken over a relatively large area. Despite the prevalence of grassed swales within roadway right-of-ways that convey and treat road runoff, data on the performance of swales with regards to infiltration and contaminant capture is relatively sparse. This study will document the infiltration parameters of eleven grassed swales/ drainage ditches located in the Twin-Cities, MN.
Method
Sixteen highways were selected around the Twin Cities metropolitan area in Minnesota where swales are located at the median or at the side of the highways. Soil samples at the swales located near each of the highways were collected to perform textural analysis to identify the soil texture class of that swale. On each soil sample wet sieving analysis (ASTM D6913) and hydrometer analysis (ASTM D422) were performed to determine % clay, % silt and % sand in a soil sample. Using these percentages in a textural triangle (USDA, 2014), the soil texture class was identified. Based upon the soil texture class of the swales, five highways were finally selected for this study for five types of soil combination.
At each highway, two swales located next to each other were chosen and infiltration measurements were taken at 8~10 locations of each swale using a Modified Philip Dunne (MPD) Infiltrometer (Ahmed et. al 2014) within a 7 m (20 ft) long stretch on the highway in Fall 2011. A total of 17~20 infiltration measurements at swales were collected for each of the five highways. In addition, an intensive 104 measurements were taken on Hwy 51 in Madison, WI. The infiltrometer was used to calculate the field-saturated hydraulic conductivity (Kfs) and soil suction (ψ) of the soil at that location. Use of the MPD infiltrometer allowed infiltration measurements to be taken in multiple locations simultaneously. For example, with a three person team measurements can be taken at 20 locations of the same swale in a half day, and with a five person team 104 measurements were taken at one swale in 1.5 days. Figure 1 shows the crew taking infiltration measurements in a swale located near highway 51 and the picture of MPD infiltrometer.


Figure 1: (a) Modified Philip Dunne (MPD) Infiltrometer, and (b) Collecting infiltration measurement at Hwy 51, Arden Hills, MN using the MPD Infiltrometer
Among these five highways three were chosen where repeated infiltration measurements at swales were taken the following spring. For each highway a total of 20 infiltration measurements were taken at two swales. The purpose of taking the measurements in Spring 2012 was to analyze the effect of season on the field-saturated hydraulic conductivity (Kfs) which is derived from the infiltration measurement of the swale.
Again at each of these three highways three swales were chosen and at each swale infiltration measurements were taken on three different days in Summer 2012 so that each day the initial soil moisture content is different. For each initial soil moisture content 18 to 21 infiltration measurements were taken. The purpose was to analyze the effect of soil moisture content on the geometric mean Kfs and distance from the outflow pipe downstream. The distance from the outflow pipe was hypothesized to be important because sedimentation should increase as the pipe is approached, and the sedimentation should decrease the Kfs.
Results and Discussion
Soil texture class analysis
As discussed in the method section, after collecting a soil sample from the swales located near sixteen highways, soil textural analysis was performed on the soil samples. The lists of soil texture class for different swales are given in Table 1. In Table 1, if the same highway is addressed in two or more rows it indicates that the swale located in that highway contains all corresponding textural classes of soil (i.e. Hwy 35E, Hwy 35W near TH 10).
Table 1: Soil texture class of different swales located in Minnesota
| Swale Location | Soil Texture Class |
| Hwy 10, Hwy 35E, Hwy 35W near TH 10 | Sand |
| Hwy 5, Hwy 47, Hwy 65, Hwy 96, Hwy 97, Hwy 77, Hwy 7, Hwy 35W Burnsville, Hwy 35E, Hwy 35W near TH 10 | Loamy sand and Sandy loam |
| Hwy 51, Hwy 36 | Loam and Sandy loam |
| Hwy 212 | Silt loam and Loam |
| Hwy 13 | Loam, Sandy clay loam and Silt |
Uncertainty Analysis
An uncertainty analysis was conducted on the Kfs values derived from the 83, 42, 52 and 63 infiltration measurements on Hwy 51 Madison swale, Hwy 47 swale, Hwy 51 Arden Hills swale and Hwy 212 swale, respectively. The Kfs values of swales were observed to be log-normally distributed. The nonparametric bootstrap method was used to develop confidence intervals around the geometric mean of each data set mentioned above. Figure 2. shows the 95% confidence interval around the geometric mean. The X-axis represents the number of measurements and Y axis represents the 95% confidence interval of the geometric mean value normalized by the geometric mean.
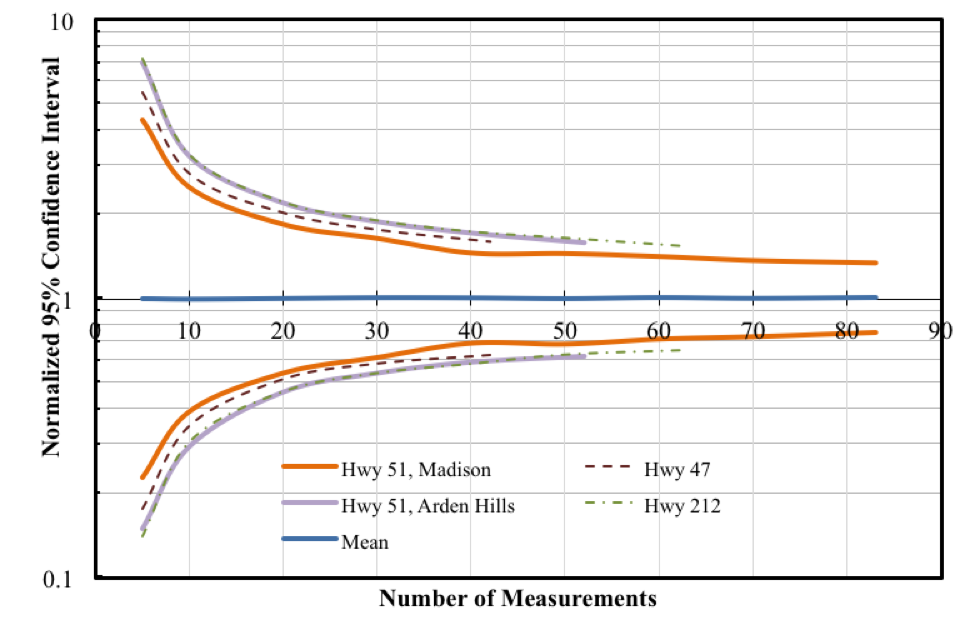
Figure 2: Confidence interval on infiltration measurements
From Figure 2. we can conclude that:
- A large uncertainty of greater than a factor of 4 is associated with five or less measurements,
- With 10 measurements the uncertainty decreases to a factor of 2.5 ~ 3.25.
- With 20 measurements the uncertainty decreases to a factor of 1.8~2.25.
- Between 40 to 83 measurements uncertainty decreases to a factor of 1.7 (for 40 measurements) to 1.3 (for 83 measurements).
The uncertainty of the geometric mean does not decrease as rapidly beyond 20 measurements. This is roughly at the “knee” of the upper confidence interval curve. It indicates that based on the infiltration measurement data of the Twin Cities swales approximately 20 infiltration measurements is an optimum balance between effort and accuracy of Kfs measurements.
Summary of derived hydraulic conductivity obtained from the infiltration measurements
For each soil texture class one highway was selected for infiltration measurement and the number of highways was narrowed down to five. Infiltration measurements were taken in the swales located near these five highways in Fall of 2011. Table 2 shows the summary of the derived hydraulic conductivity values from the infiltration measurements for these five swales. The geometric mean of Kfs was generally higher than the values provided in the literature (Rawls, et al. 1983). This could be due to macropores from grass roots that have died in past winters. The coefficient of variation is also relatively high, indicating the need for multiple measurements in order to document the mean Kfs of a given swale.
Table 2: Comparison of derived hydraulic conductivity values from the infiltration measurements in swales for different soil texture classes
| Location | Soil texture class | Number of measurements | Geometric mean of Kfs, (cm/hr) | Coefficient of variation (COV)* of Kfs |
| Hwy 47 | Loamy sand & Sandy loam | 20 | 2 | 3.55 |
| Hwy 51 | Loam & Sandy loam | 20 | 2 | 3.34 |
| Hwy 212 | Silt loam & Loam | 20 | 0.75 | 14.38 |
| Hwy 13 | Loam, Sandy clay loam & Silt loam | 19 | 3.9 | 5.60 |
| Hwy 77 | Loamy sand | 17 | 2 | 1.09 |
*COV = standard deviation of log transformed data ⁄ mean of log transformed data
Statistical analysis on derived hydraulic conductivity values from the infiltration measurements
Statistical analysis was performed on the Kfs values obtained from infiltration measurements taken in Fall 2011, Spring 2012 and Summer 2012 to answer these questions:
- Is there any significant difference among the geometric mean Kfs value of the same swale for different initial soil moisture content? Moisture content should not affect the value of Kfs.
- Is there are any significant differences among geometric mean Kfs for three different swales of the same highway in the longitudinal direction? This test was performed to test whether sediment that would be eroded in the swale during a large storm could settle near the outlet pipe.
- Is there any significant difference between the geometric mean Kfs value of the same swale with season? Freeze-thaw may affect compaction and the Kfs value.
- Is there any significant difference between the geometric mean Kfs value at the side slope and at the center of the same swale? Sedimentation and variable compaction could result in the center of the swale having a lower Kfs.
For the statistical analyses the Tukey-Kramer test (Kleinbaum et al., 2007) was performed when the number of measurements between two sets of data are not equal and an ANOVA test was performed when the number of measurements between two sets of data are equal. The Tukey-Kramer or ANOVA test was performed for 90, 95 and 99% confidence intervals. After performing the statistical analysis following results were obtained:
- There is no significant difference among geometric mean Kfs value in the same swale for different moisture content within 90, 95 and 99% confidence interval, with the exception of one swale in Hwy 47.
- For some swales there is a significant difference among the geometric mean Kfs of the same highway in the longitudinal direction and in some swales there is no significant difference. However, the trend with distance from the outlet did not always have the same sign. We thus did not see any substantial drop in Kfs with sedimentation.
- No significant difference was observed between the geometric mean Kfs values of fall and spring with 90, 95 and 99% confidence intervals. Freeze-thaw did not have a tremendous effect upon Kfs.
- Significant difference between geometric mean Kfs values of the side slopes and the center of the swale was observed for swales at a 95% confidence interval, but the side slopes exhibited both a higher and a lower Kfs than the center of the swale. There was therefore no trend in the differences.
Conclusion
Soils from 16 grassed roadside swales that were representative of Minnesota soils were sampled and soil textural analysis was performed on the soil samples. From these, five were selected for analysis of infiltration rates, chosen to represent the range of soil samples found in Minnesota swales. From these analyses we can make the following conclusions:
- The near-surface (upper 20cm) Kfs values of the five swales varied from 0.75 cm/hr to 3.9 cm/hr, and were roughly a factor of 2.8 (mean) or 1.5 (median) greater than the published mean values (Rawls et al., 1983) for the soil texture classes. This may be due to roots creating macropores in the near-surface soil, which is normally not taken into consideration in laboratory soil permeability tests.
- Soil moisture content and season has no effect on the mean field-saturated hydraulic conductivity of a swale. This is expected, because Kfs values should not be dependent upon soil moisture and should not change significantly with season.
- The number of measurements of Kfs is recommended to be approximately 20 from Figure 2 to capture the spatial variability and estimate a geometric mean Kfs value with a sufficiently low uncertainty.
- Distance from the downstream may or may not have an effect on the geometric mean Kfs of the swale, similar to what was found in the literature (Yonge 2000, Barrett 2004a, 2004b, Ahearn and Tveten 2008). There was no evidence that deposition at the lower reaches of the swale caused a lower Kfs in that region, possibly because the grass roots broke up the sedimentation and created macropores in the near-surface soil or because sedimentation did not favor the lower reaches of the swale. This result implies that infiltration measurements should be spread over the swales of interest to obtain accurate results and measurements should be taken at both the side slope and center of the swale.
References
- Ahearn, D., and Tveten, R., 2008. Legacy LID: Stormwater treatment in unimproved embankments along highway shoulders in Western Washington, International Low Impact Development Conference, November 16-19, 2008, Seattle, Washington.
- Ahmed F., Nestingen R., Gulliver J.S., Nieber J.L. and Hozalski R., 2014. Modification to the Philip Dunne Permeameter for assessment of surface infiltration rate, Vadose Zone Journal, accepted.
- Asleson, B.C., R.S. Nestingen, J.S. Gulliver, R.M. Hozalski, and J.L. Nieber, 2009. Performance assessment of rain gardens, Journal of the American Water Resources Association, 45(4), 1019-1031.
- A.S.T.M. D422-63, 2007. Standard test method for particle size analysis. Annual Book of ASTM Standards, D18.03 Amer. Soc. Testing Materials, West Conshohocken, PA.
- A.S.T.M. D6913-04, 2009. Standard test methods for particle size distribution (Gradation) of soils using sieve analysis, D18.03. Annual Book of ASTM Standards, Amer. Soc. Testing Materials, West Conshohocken, PA.
- Barrett, M.E., Walsh, P.M., Malina, J.F., and Charbeneau, R.B., 1998a. Performance of vegetative controls for treating highway runoff, Journal of Environmental Engineering, 124(11), 1121-1128.
- Barrett, M.E., Keblin, M.V., Walsh, P.M., Malina, J.F., and Charbeneau, R.B., 1998b. Evaluation of the performance of permanent runoff controls: summary and conclusions, Center for Transportation Research, University of Texas at Austin, Report #: 2954-3F, Available online at: http://www.utexas.edu/research/ctr/pdf_reports/2954_3F.pdf
- Barrett, M.E., 2004a. Performance and design of vegetated BMPs in the highway environment, Critical Transitions In Water And Environmental Resources Management, Proceedings of The 2004 World Water and Environmental Resources Congress, June 27-July 1, 2004, Salt Lake City, Utah.
- Barrett, M.E. 2004b. Performance and design of vegetated BMPs in the highway environment. Center for Research in Water Resources, University of Texas, Austin, TX, USA.
- Deletic, A., and Fletcher, T. D., 2005. Performance of grass filters used for stormwater treatment- A field and modelling study, Journal of Hydrology, 317(3-4), 261-275.
- Kleinbaum D. G., Kupper L. L., Nizam A., Muller K. E. 2007. Applied regression analysis and other multivariable methods, Duxbury Press, Belmont, CA.
- Olson, N.C., J.S. Gulliver, J.L. Nieber and M. Kayhanian, Remediation to Improve Infiltration into Compact Soils, Journal of Environmental Management, 117, 85-95, 2013.
- Paus, K.H., J. Morgan, J.S. Gulliver, T. Leiknes and R.M. Hozalski, Assessment of the Hydraulic and Toxic Removal Capacities of Bioretention Cells after 2 to 8 Years of Service, Water, Soil and Air Pollution, 225 (1803), 2013.
- Rawls W. J., Brakensiek D. L., Miller N., 1983, Green-Ampt Infiltration Parameters from Soil Data, Journal of Hydraulic Engineering, Vol 109, iss 1, 62-70.
- Yonge, D.R., 2000. Contaminant detention in highway grass filter strips. Report No. WA-RD 474.1, Washington State Department of Transportation, Olympia, Washington, USA.
We want to hear from you!!!
Let us know your thoughts, experiences, and questions by posting a comment. To get you thinking, here are a few questions:
- Have you ever measured the infiltration rate of a drainage ditch? What method did you use and how many measurements did you take?
- Do you think soil texture classification provides enough information about the infiltration rate of a swale/ drainage ditch?