
UPDATES: May 2021

UPDATES is an email newsletter on stormwater management, assessment (including monitoring), and maintenance research at St. Anthony Falls Laboratory and the University of Minnesota.
Planning Phase Siting of Stormwater Infiltration Practices
May 2021 (volume 16 - issue 2)
Contributed by Nicholas P. Tecca1,2, John S. Gulliver1,2, and John L. Nieber3
- Department of Civil, Environmental, and Geo-Engineering, University of Minnesota
- Saint Anthony Falls Laboratory, University of Minnesota
- Department of Bioproducts and Biosystems Engineering, University of Minnesota
Funding: This paper is based on a project supported by the Minnesota Local Road Research Board under the authority of the State of Minnesota, Department of Transportation Contract No. 1003325.
Technical Advisory Panel: Dwayne Stenlund (Technical Liaison), Beth Klemann, Alan Rupnow, Tara Carson, Forrest Kelly, Ryan Johnson, Rick Baird, Noah Czech, Steve Gurney, Mike Isensee, Todd Smith, and Alan Rindel
Introduction
Infiltration stormwater control measures (SCMs) are an important tool that can be implemented to meet the stormwater volume reduction requirements of the MPCA Construction Stormwater General Permit (Minnesota Pollution Control Agency, 2018). Infiltration SCMs include infiltration basins, bioinfiltration basins, infiltrating rain gardens, grassed swales, and others. Unfortunately infiltration practices have been estimated to have a failure rate between 10% to 50% (Bean & Dukes, 2016; CTC & Associates LLC, 2018; Hilding, 1994; Lindsey, Roberts, & Page, 1992). This failure represents significant capitol cost to remediate the practice, and the failure rate has likely inhibited the adoption of infiltration SCMs. While there are many factors that may contribute to infiltration failure, selecting an appropriate site can reduce the failure risk.
Need for an Automated Screening Tool
There is a need for a methodology to consistently evaluate the potential of a location for supporting infiltration SCMs. While experienced water resources professionals can manually evaluate the available data, these experts are not always involved at the earliest project stages. In addition, manually reviewing large project areas can be tedious and time-consuming. The criteria for determining a suitable site is not always clearly defined and may vary between engineers, which can lead to communication issues particularly on projects with multiple years from planning to bidding. Finally, siting decisions often occur prior to collecting field data and it would be beneficial to have a screening tool to guide the field data collection to the areas where infiltration is most likely to be successful. A screening tool would help provide justification for how a particular site was selected, or why infiltration was determined not to be feasible.
How it Works
A screening tool was developed to work in ESRI ArcMap but can be coded to work in any GIS system. The tool creates a variable called the preliminary infiltration rating or PIR. A numeric rating is calculated by multiplying the numeric rating of input variables using a fuzzy logic algorithm. The PIR is thus a qualitative category that indicates the infiltration potential of the site based on the numeric rating.
There are four input variables relating to the site suitability that were identified. These include the saturated hydraulic conductivity (Ksat), the depth to water table, the topographic slope, and the relative elevation. The saturated hydraulic conductivity of the soil defines the limiting rate that stormwater can infiltrate into the subsurface. The depth to groundwater describes the likelihood of groundwater-surface water interactions occurring as a result of the infiltration SCM. The topographic slope relates to the constructability and safety of an infiltration SCM, as moderately steep slopes require larger footprints than minimal slopes to construct flat infiltration SCMs and infiltrating additional water near steep slopes may contribute to slope stability issues. The relative elevation describes the position on the hillslope and the potential to direct surface runoff to an area under gravity flow conditions.
Many jurisdictions prohibit infiltration SCMs in environmentally sensitive areas. Spatial data identifying these environmentally sensitive areas may overlay the output composite rating to identify areas where infiltration SCMs are likely to be prohibited. Environmentally sensitive layers will vary based on region and jurisdiction but may include information identifying wetlands, shallow bedrock, karst regions, contaminated soils, and source water protection areas.
In contrast to classical logic where a parameter is classified as either false or true, fuzzy logic allows for a parameter to be considered partially true. When stated mathematically, classical logic only allows the values of 0 or 1, whereas fuzzy logic can use any value on the range of 0 to 1. Infiltration SCMs have a range of potential performance with a gradual transition from excellent to poor. The parameters contributing to the overall performance exhibit a similar gradual transition from excellent to poor. A fuzzy logic model was thus selected to aggregate the variables into a composite rating. A product operator was chosen to combine the fuzzy logic variables, as this allows a single unacceptable value to rate a given location as a poor site for an infiltration SCM. The composite rating is the Preliminary Infiltration Rate or PIR, as defined in Equation 1:
PIR = WTKsat ∗ WTdep2wt ∗ WTslope ∗ WTrelel (1)
The variables WTKsat, WTdep2wt, WTslope, and WTrelel are weights associated with the Ksat, depth to water table, topographic slope, and relative elevation, respectively. The PIR defined in equation 1 outputs a number that is compiled into a category. Four categories are utilized to represent the relative likelihood of successfully implementing an infiltration SCM. The categories were established such that if a single input variable has a poor quality represented by a weight of 0.01, the composite category would be designated as Poor. However, if all input variable weights are greater than 0.01, the area will be rated as Moderate, Good, or Excellent.
The saturated hydraulic conductivity and depth to water table are available through USDA Web Soil Survey (https://websoilsurvey.sc.egov.usda.gov/App/HomePage.htm), or other methods of accessing the USDA NRCS SSURGO dataset. The topographic slope and relative elevation are both calculated in ArcMap based on a 3-meter DEM, which in Minnesota can be accessed through MnTopo (http://arcgis.dnr.state.mn.us/maps/mntopo/) or other sources. Similar DEMs are available in most states. Both the soils data and topographic data have a broad geographic coverage.
Does it Work?
The PIR was evaluated for Anoka County, MN as shown in Figure 1. The PIR is a 10-meter raster displayed as a heat map of the areas most likely to support an infiltration practice. The PIR was then compared to a rain garden maintenance dataset provided by the Anoka Conservation District. Figure 2 shows the locations of the 70 rain gardens used to calibrate the PIR weights and categories, as well as the 34 rain gardens used to validate the PIR performance. A PIR category is correct if it matches the maintenance dataset, e.g. both indicate good performance. A PIR category is conservative if the maintenance dataset indicates the rain garden is performing better than the PIR would have predicted, e.g. the maintenance dataset indicates good performance and the PIR predicts moderate performance. The PIR produced a correct or conservative prediction of the rain garden performance in 85% of the validation rain gardens.
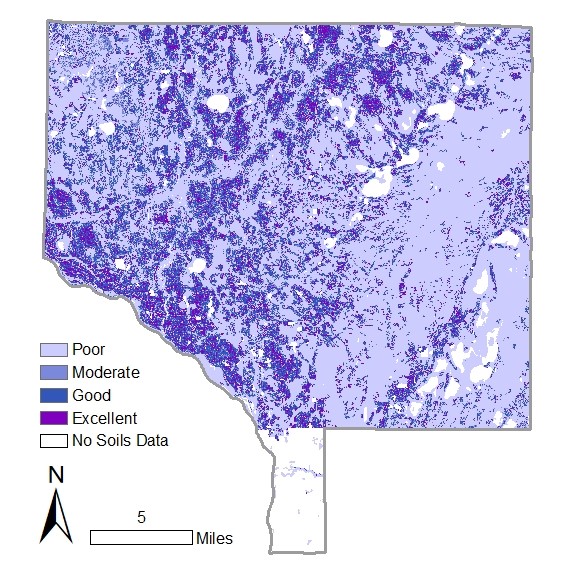
Figure 1 PIR for Anoka County, MN
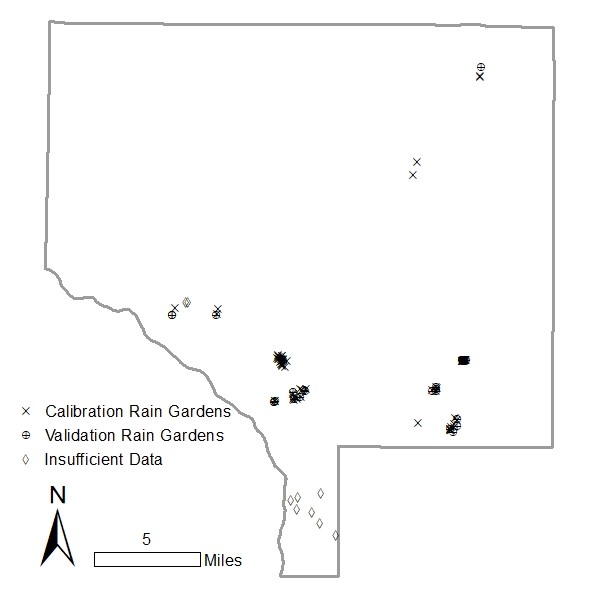
Figure 2 Anoka Conservation District Rain Garden Maintenance dataset used to calibrate and validate the PIR
Benefits to Practitioners
The PIR provides a rapid method to screen a large area for the likelihood to successfully support an infiltration SCM. Additional spatial data relevant to the project can be overlaid on the PIR heat map. Figure 3 shows examples of the PIR overlaid with areas where infiltration is restricted following criteria within the MPCA Construction Stormwater General Permit. Other relevant data that could be incorporated include property information, right of way information, and other types of restrictions or prohibitions. The PIR is applicable to transportation, municipal planning, private site development, and other land disturbing activities where infiltrating stormwater is under consideration.
The PIR can be incorporated into the existing project planning activities, and can provide numerous benefits including:
- The PIR can be used in support of both siting decisions and feasibility determinations,
- The calculation is fast, Figure 3 can be completed in 2 - 4 hours,
- The PIR produces consistent results between projects,
- Decisions can be easily visually communicated between project partners,
- GIS data is often available prior to site specific field work,
- Underlying data can be reviewed and verified, and
- PIR results can guide site specific field work, that ultimately verifies the infiltration potential.
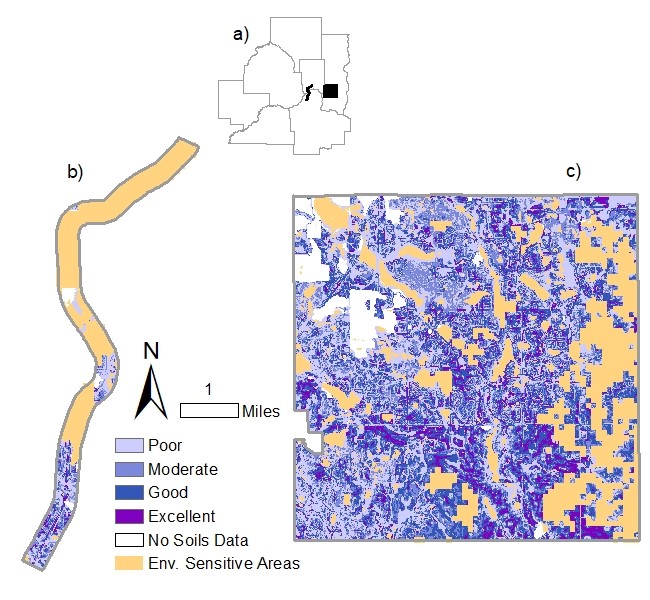
Figure 3 Examples implementing the preliminary infiltration rating with overlays of environmentally sensitive areas: (a) Minneapolis–St Paul seven-county metropolitan area with locations of examples; (b) I-35E from 10th Street in St. Paul, Minnesota, to Lone Oak Road in Eagan, Minnesota; and (c) the City of Woodbury, Minnesota.
Get the full report: For the full report with the details, please see Tecca, N. P., Gulliver, J. S., & Nieber, J. L. (2021). Siting Surface Infiltration-Based Stormwater Control Measures using a Geographic Information Systems (GIS) Approach. Journal of Sustainable Water in the Built Environment, 7(2).
References
- Bean, E. Z., & Dukes, M. D. (2016). Evaluation of Infiltration Basin Performance on Coarse Soils. Journal of Hydrologic Engineering, 21(1).
- CTC & Associates LLC. (2018). Infiltration Basins: Standards and Procedures to Ensure Performance.
- Hilding, K. (1994). Longevity of Infiltration Basins Assessed in Puget Sound. Watershed Protection Techniques, 1(3), 124–125.
- Lindsey, G., Roberts, L., & Page, W. (1992). Inspection and Maintenance of Infiltration Facilities. Journal of Soil and Water Conservation, 47(6), 481–486.
- Minnesota Pollution Control Agency. (2018). Construction Stormwater General Permit.
- Tecca, N. P., Gulliver, J. S., & Nieber, J. L. (2021). Siting Surface Infiltration-Based Stormwater Control Measures using a Geographic Information Systems (GIS) Approach. Journal of Sustainable Water in the Built Environment, 7(2).