UPDATES: October 2016
Iron Enhanced Sand Filtration for Agricultural Tile Drainage
October 2016 (volume 11 - issue 4)
Contributed by Peter T. Weiss, Professor, Department of Civil Engineering, Valparaiso University; Andy Erickson, Research Fellow; and John S. Gulliver, Professor, St. Anthony Falls Laboratory and the Department of Civil, Environmental, and Geo-Engineering, University of Minnesota .
In Collaboration with the Wright County Soil and Water Conservation District.
Funded by the Minnesota Pollution Control Agency.
Introduction
Phosphorus is typically the limiting nutrient for plant growth in temperate freshwater systems (Schindler 1977). Thus, the addition of phosphorus to surface waters can exacerbate algae blooms and eutrophication. In fact, the USEPA lists almost 3000 surface water impairments due to phosphates or phosphorus (USEPA 2016). In order to meet Total Maximum Daily Load (TMDL) plans that seek to reduce phosphorus concentrations in these impaired waters, phosphorus loadings to the water bodies must be reduced. A reduction of phosphorus in agricultural runoff could help achieve TMDL goals.
Stuntebeck et al. (2011) found that 51% of the phosphorus in agricultural runoff was dissolved. This value is similar to typical urban stormwater fractions, which have been found to be approximately 43% (Kayhanian et al. 2007). Erickson et al. (2007), however, showed that dissolved fractions of over 90% are not uncommon. With TMDL plans typically targeting from a 60 to 80% reduction in phosphorus loads, the dissolved fraction, at least in part, must be reduced if TMDL goals are to be achieved.
A technology that has been documented (Erickson et al. 2007, 2012) to have the ability to remove a significant portion of the dissolved phosphorus fraction is iron enhanced sand filtration (IESF). IESF uses iron shavings, at 5-7% by weight, mixed with typical concrete sand (e.g., ASTM C 33). When the iron rusts and becomes oxidized its positive charge has the ability to retain negatively charged phosphate ions through surface adsorption. With much of the dissolved phosphorus fraction in the form of phosphate, IESF has been shown to have the ability to retain 80% or more of influent dissolved phosphorus loads (Erickson et al. 2007, 2012). This technology, however, has only been verified in the lab (Erickson et al. 2007) and in one field application in an urban (i.e., non-agricultural setting) (Erickson et al. 2012, 2015). Not only may field performance vary from that observed in a laboratory setting, but performance may also vary due to differences in the source of, and thereby the constituents in, the runoff (i.e., urban vs. agricultural). Thus, the performance of an IESF in an agricultural setting is not known. In order to help fill this knowledge void, a field demonstration/monitoring project of an IESF that receives agricultural runoff is underway. The project objective is to verify and/or determine the ability of IESF to reduce dissolved phosphorus loads in agricultural runoff.
Project Location and Sand Filter Specifications
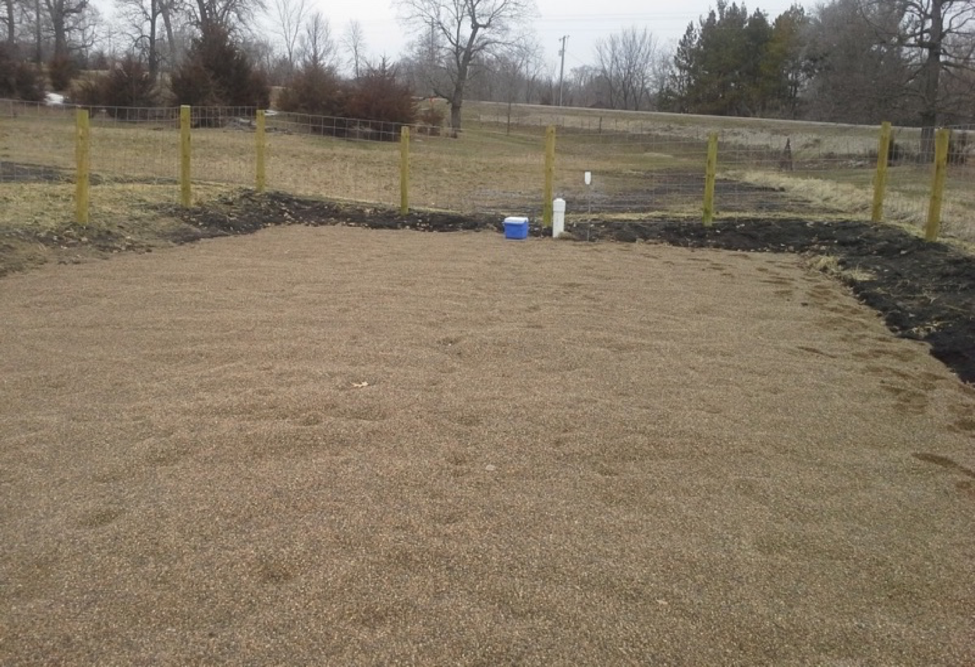
An IESF measuring 50 feet by 20 feet was installed near Martha Lake and Charlotte Lake in Wright County, Minnesota (Figure 1). The sand filter receives runoff from approximately 19 acres of farm land used for crops and livestock. These lakes have naturally low levels of phosphorus (35 μg/L total P) but receive runoff from agricultural drain tiles through ditches and conveyances. Phosphorus concentrations in the agricultural runoff, as determined by taking periodic grab samples, have ranged from 73 - 460 μg/L total P and 31 - 242 μg/L dissolved P.
Figure 1. Site photo of Iron Enhanced Sand Filter for Treating Agricultural Drainage.
The cross-section of the IESF consists of, from top to bottom, 12 inches of ASTM C33 construction sand with 5% iron shavings by weight, 6 inches of coarse gravel containing 4-inch diameter perforated PVC underdrains (Figure 2). Flow monitoring equipment was installed on the downstream end of the filter in order to measure effluent flow rates (influent flow rates are assumed to be equal to effluent values). ISCO automatic samplers were installed to take influent and effluent samples on a flow-weighted basis. Atmospheric data, including rainfall as measured by a tipping bucket rain gauge and air temperature, are also recorded.
Figure 2. Cross-section of Iron Enhanced Sand Filter.
Results
In 2015 a total of seven rainfall-runoff events were monitored and an additional seven events have been monitored in 2016. The date, total rainfall depth, total runoff volume filtered, and the event mean concentration (EMC) of soluble reactive phosphorus (i.e., phosphate) of the influent and effluent for each event are given in Table 1. Also shown in Table 1 are the percent reduction in EMC, phosphate mass loads in and out, the percent mass load reductions for each event, and yearly and overall totals where relevant.
Table 1: Monitoring results from 2015 & 2016. Samples measured below detection limits (10 μg/L, indicated by *) are reported at half the detection limit (5 μg/L), and removal is calculated using half the detection limit.
| Rainfall Start | Rainfall Depth (in) | Filtered Volume (10^6 L) | Volume Percent Exceedance | Phosphate EMC In (µg/L) | Phosphate EMC Out (µg/L) | EMC Reduction | Phosphate Mass In (g) | Phosphate Mass Out (g) | Phosphate Mass Removal |
|---|---|---|---|---|---|---|---|---|---|
| 7/18/15 | 1.87 | 0.476 | 17% | 241 | 40 | 83% | 115 | 19 | 83% |
| 7/24/15 | 0.78 | 0.082 | 58% | 45 | 5* | 89% | 3.7 | 0.4 | 89% |
| 7/28/15 | 0.73 | 0.103 | 42% | 61 | 12 | 81% | 6.3 | 1.2 | 81% |
| 10/8/15 | 0.70 | 0.031 | 100% | 52 | 14 | 73% | 1.6 | 0.4 | 73% |
| 10/23/15 | 0.32 | 0.096 | 50% | 54 | 5* | 91% | 5.2 | 0.5 | 91% |
| 10/27/15 | 1.85 | 0.784 | 0% | 180 | 79 | 56% | 141 | 62 | 56% |
| 11/11/15 | 3.00 | 0.699 | 8% | 146 | 72 | 51% | 102 | 50 | 51% |
| 2015 Totals | 9.25 | 2.269 | 374.3 | 133.7 | 64.3% | ||||
| 5/23/16 | 1.93 | 0.385 | 25% | 25 | 5* | 80% | 10 | 1.9 | 80% |
| 6/3/16 | 0.36 | 0.062 | 75% | 114 | 5* | 96% | 7.1 | 0.3 | 96% |
| 6/12/16 | 0.74 | 0.040 | 92% | 100 | 5* | 95% | 4.0 | 0.2 | 95% |
| 6/17/16 | 0.16 | 0.068 | 67% | 78 | 5* | 94% | 5.3 | 0.3 | 94% |
| 7/5/16 | 0.37 | 0.210 | 33% | 29 | 10 | 66% | 6.1 | 2.0 | 66% |
| 7/10/16 | 0.63 | 0.045 | 83% | 80 | 16 | 80% | 3.6 | 0.7 | 80% |
| 2016 Totals | 4.19 | 0.810 | 35.9 | 5.5 | 84.6% | ||||
| Grand Totals | 13.44 | 3.080 | 410.2 | 139.2 | 66.1% |
In 2015, seven rainfall events totaled 9.25 inches of rain and generated over 2.2 million liters of filtered runoff. Influent EMC values ranged from 45 to 241 μg/L. Percent reductions in EMC ranged from 51% to 91% and, because there was no infiltration into the existing soil and inflow equaled outflow, the percent reductions in mass load for each event are identical to EMC reductions. Overall, the filter received 374.3 grams of phosphate in 2015 in the influent and discharged 133.7 g of phosphate in the effluent for an overall reduction in the phosphate load of 64%.
In 2016, rainfall depth totaled 4.19 inches for the six events monitored to date and this generated 0.8 million liters of filtered runoff. Influent EMC values ranged from below detection (reported as 5* μg/L) to 114 μg/L and percent EMC reductions ranged from 66% to 96%. The filter received 35.9 g of phosphate in the influent and discharged 5.5 g of phosphate in the effluent. This amounts to a 85% reduction in the phosphate mass load.
The rainfall, runoff volume, and phosphate concentrations for 2016 were about 50% less than those in 2015, and the influent and effluent mass in 2016 were about 90 - 96% less than in 2015. For 2015 and 2016 combined, the total mass load of phosphate entering the filter (410.2 g) divided by the total influent volume (3.08x10⁶ L) gives an overall EMC of 133 μg/L for the influent. Similarly, the overall effluent EMC is 45.2 μg/L, which corresponds to an overall mass load reduction of 66% for 2015-2016 monitored events. Filter performance has not decreased over the monitoring period (2015 to 2016). In fact, the percent mass load reduction has increased from 64% in 2015 to approximately 85% in 2016, though less volume, concentration, and mass have been treated in 2016 compared to 2015. It is possible that filter performance is a function of runoff volume or influent concentration.
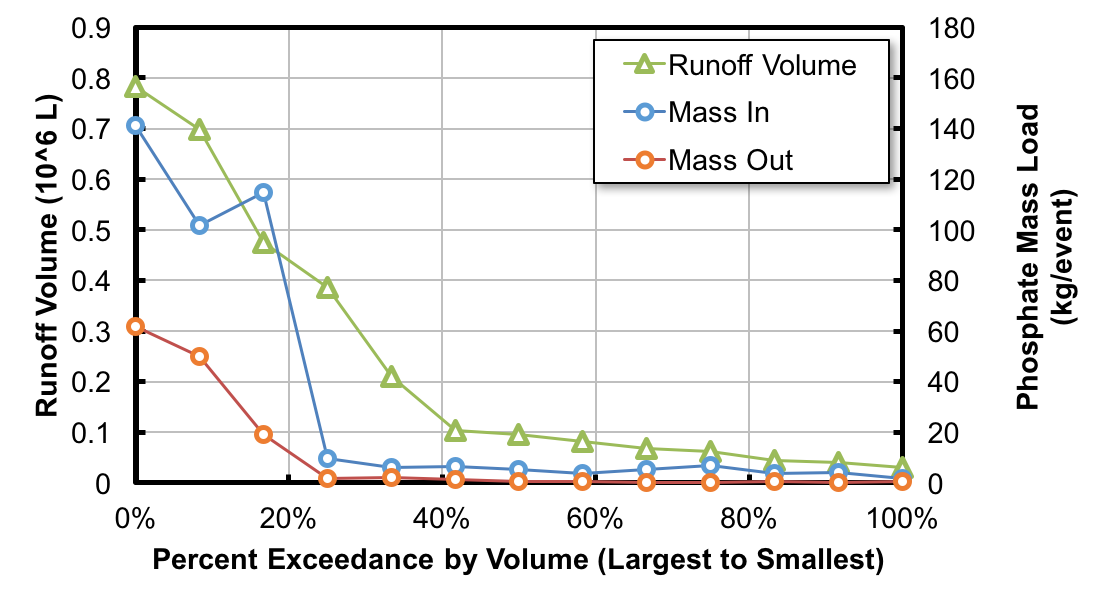
To investigate if filter performance is a function of runoff volume, results were plotted as a function of runoff volume percent exceedance in Figure 3. This plot shows runoff volume and phosphate mass loads in and out, as a function of runoff volume percent exceedance. All of the 13 monitored events are plotted in Figure 3, results corresponding to the largest runoff volume event (0.784x10⁶ L) are plotted at zero percent exceedance because this events runoff volume was never exceeded. Results corresponding to the second largest runoff event (0.699x10⁶ L) are plotted at 8% exceedance because this runoff volume was only exceeded by 1 of the 12 other events, or 8% of the time. The results corresponding to the remaining 11 events are plotted in a similar manner.
Figure 3. Runoff volume percent exceedance plot showing Event Phosphate Mass In and Out.
As shown in Figure 3, the runoff volume for the four largest events contributes most of the runoff, but the phosphate event mass load contributed by the three largest events (10/27/15, 11/11/15, 7/18/15) is substantially more than the other 10 events. This suggests that treatment of the largest events could have substantial impact on the overall average annual performance. Similar results were observed for Iron Enhanced Pond Perimeter Trenches.
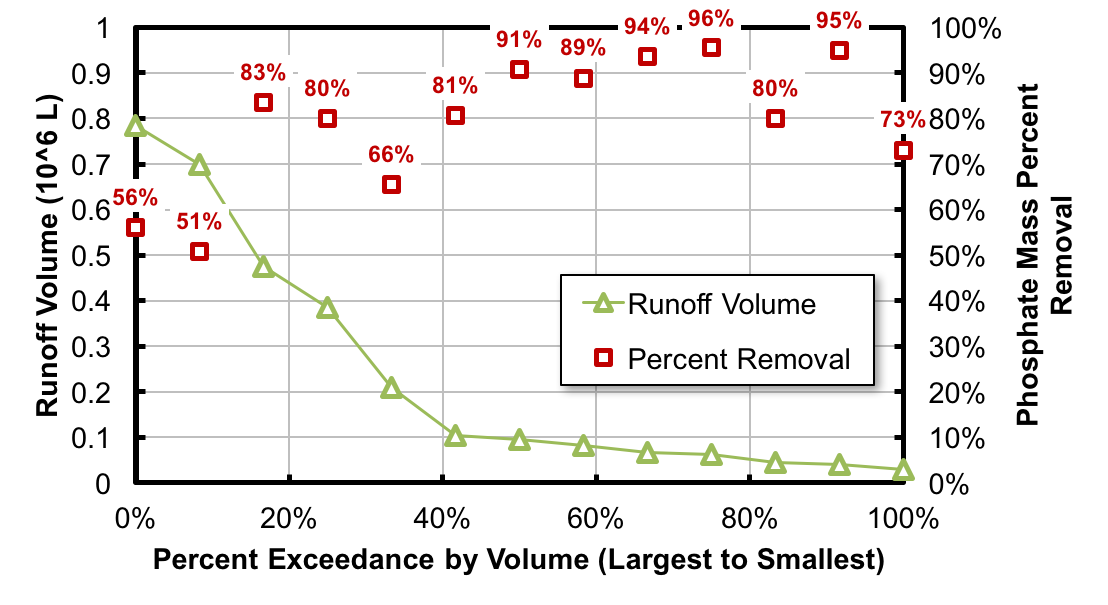
Figure 4 shows the percent removal based on phosphate mass, and that most events achieved a phosphate removal of 80% or more. The smallest event (0.031x10⁶ L) achieved 73% phosphate removal; one medium-sized event (0.210x10⁶ L) achieved 66% removal; and the two largest events (0.784x10⁶ L and 0.699x10⁶ L) achieved 56% and 51% removal, respectively. Because the largest runoff events have higher mass loads than smaller runoff events they have a greater impact on the overall phosphate mass load reduction. Together, the two largest events produced 59% of the total influent mass load (243 g of 410 g) and the three largest events produced over 87% of the total influent mass load (358 g of 410 g). Thus, the overall phosphate mass load reduction was 66% even though half of the events achieved over 80% reduction.
Figure 4. Runoff Volume and Phosphate Mass Percent Removal by Percent Exceedance of Volume.
Summary
As a field demonstration project to verify the ability of iron enhanced sand filtration to reduce dissolved phosphorus loads in agricultural runoff, a surface IESF was installed in Wright County, Minnesota. Thirteen rainfall/runoff events over 2015 and 2016 have been monitored to date. The events have had a total influent phosphate mass load of 410.2 g with the effluent mass load of 139.2 g, which corresponds to a 66% reduction in mass load between influent and effluent.
More than half of the events reduced the phosphate mass load by over 80% and two other events reduced the load by 66% and 73%. These events account for approximately 41% of the total influent load throughout both years. The remaining 59% of the influent load was contributed by the two largest events, which reduced the phosphate load by 56% and 51%, respectively. This explains why the overall load reduction (66%) is less than 80%, though for most events it can be expected that 80% of the phosphate will be captured by the IESF.
Acknowledgements
The authors thank the Wright County Soil and Water Conservation District for their tireless effort while partnering on this project.


