UPDATES: June 2016
Comparison of Turbidity Meters for Measurement of Suspended Solids Concentration
June 2016 (volume 11 - issue 2)
M.S. Thesis research of Rebekah Perkins. Contributed by Bruce Wilson, Professor, and Bradley Hanson, Senior Scientist, of Bioproducts and Biosystems Engineering; and John Gulliver, Professor, Department of Civil, Environmental and Geo-Engineering, St. Anthony Falls Laboratory, University of Minnesota.
Funded by the Minnesota Local Road Research Board and the Minnesota Department of Transportation.
Introduction
Turbidity is an optical property of water associated with the light scattering properties of the particles suspended in water. This measurement can be used as a surrogate to determine the concentration of sediment. A turbidity meter is a device that comprises at least one light source and one photo-detector. The light source is beamed through a sample, and the light is scattered as it interacts with the particles in the water and the water itself. The photo-detector then reads how much light reaches it and at what angle, thus determining the turbidity of the sample. There are many kinds of turbidity meters. One of the goals of the project was to evaluate the differences in measured turbidity obtained from these different meters.
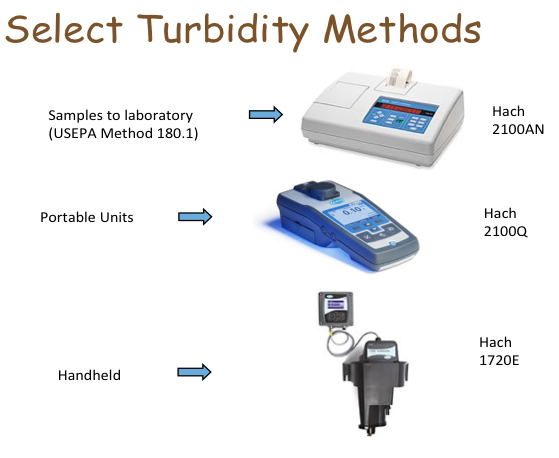
Turbidity meters have different features depending on their uses. Bench top turbidity meters are laboratory-based meters that measure the turbidity of grab samples taken from the site. Portable turbidity meters, which measure the turbidity in situ or of grab samples on-site, are more durable for traveling and on-site weather conditions. There are also handheld turbidity meters designed to continuously monitor and record turbidity in situ. These turbidity meters only measure turbidity at a point, and need to be positioned at optimal places at a site. However, they capture the changes in turbidity as runoff occurs, creating a better temporal representation of turbidity. Select illustrations of the three general types of turbidity meters are provided in Figure 1.
Figure 1. Illustration of three types of turbidity measurement (photo courtesy Hach Company).
Turbidity meters can have many different light/photo-detector set-ups. The U.S. Environmental Protection Agency (U.S. EPA, 2011) describes three standard turbidity meters. A concern in comparing the results from different meters is their technique for measuring light scatter. This is a problem because a nephelometric turbidity unit (NTU) is defined by measuring only light scattered 90° from the light source (Anderson, 2005). The addition of multiple photo detectors and angle measurements cause variance in turbidity readings. Some meters are designed to measure attenuation, backscatter, or a combination of many angles. Each of these instruments defines turbidity using a new unit and it becomes increasingly more difficult to compare measurements to an NTU. Calibration is therefore important to obtain accurate turbidity measurements.
Because construction site runoff can contain significant amounts of eroded sediment, we were interested in turbidity meters that can read turbidities upwards of 4000 NTU. This range can be accomplished by using multiple light sources and photo-detectors, different types of light sources, and different turbidity meter technologies.
Method
To better understand potential errors in using these results for field conditions, a laboratory comparison experiment was conducted with a Hach 2100N bench top turbidimeter. The laboratory study explored the range of turbidity values expected for both an individual sensor for differing soil textures and differences between sensors for a single soil texture. The five different sensors used in this experiment and their specifications are shown in Table 1. Five soils representing a range of soil textures were used for this comparison and are described in Table 2.
Table 1. List of turbidity sensors and specifications.
| Sensor | Light Source | Detector angle | Method | NTU range |
|---|---|---|---|---|
| Campbell Sci. OBS 3+ | 850 nm | 90-165 | Side scatter | 0-4000 |
| Campbell Sci. OBS500 | 850 nm | 90, 125 to 170 | Side and Back Scatter | 0-4000 |
| McVan Analite NEP495 | 860 nm | 90 | Back scatter | 0-1000 |
| YSI 6136 | 860 nm | 90 | Back scatter | 0-1000 |
| Hach 2100N | Tungsten | 90, 135, 180 | Forward scatter | 0-4000 |
Table 2. List of soils and soil properties used in turbidity probe comparison.
| Name | Type | Location | Description | Classification |
|---|---|---|---|---|
| AH T | Topsoil | Arden Hills, MN | Silty dark grey soil | Sand Loam |
| TH-23 T | Topsoil | St. Cloud, MN | Silty, greyish brown soil | Loam |
| TH-23 S | Subsoil | St. Cloud, MN | Silty, reddish orange soil | Sandy Loam 2 |
| Soil A | Subsoil | Redwing, MN | Sticky, tan soil | Silt |
| Soil B | Subsoil | Red Lake Falls, MN | Sticky, greyish tan soil | Silty Clay Loam |
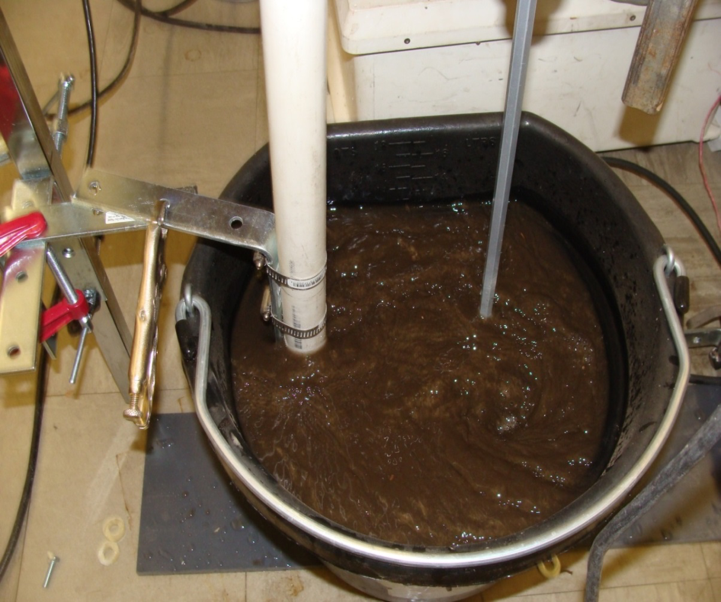
The testing apparatus and procedures were patterned after Lewis (2007). A black bucket with a capacity of twelve liters was used for a test chamber. A drill, with attached paint stirrer, was mounted above the bucket at a height that allowed the paint stirrer to spin approximately 2 cm above the bottom of the bucket and 2 cm from the side of the bucket. A bracket was then attached to the sensors so that they could be mounted in the same location for each measurement. Each of the meters was inserted separately into the bucket opposite the stirrer so that the sensor was 8 cm from the base of the bucket. A drill speed was chosen that retained the sediment particles in suspension over the range of sediment concentrations needed to attain a turbidity of 1000 NTUs for all soils. The test apparatus is shown in Figure 2.
Figure 2. Measuring turbidity with test apparatus.
Prior to starting the experiment, each meter was calibrated according to their specific manufacturer’s instructions. Twelve liters of water were added to the bucket and the meter was mounted. The drill was turned on and three turbidity readings were taken. The meter was then un-mounted, and the next meter was mounted in its place. This was repeated for all portable meters. The YSI 6136, Campbell scientific OBS500 and Analite NEP495 are each pre- programmed to take a series of readings and output an average value. The OBS3+ was programmed to average 10 readings taken every five seconds. Each probe was allowed to go through its scan interval three times and an average of the three readings was recorded. A 30 mL sample was extracted from the bucket at the depth of the sensor face. The turbidity of this sample was determined with the Hach 2100N bench top turbidimeter.
Comparison of Turbidity Meters
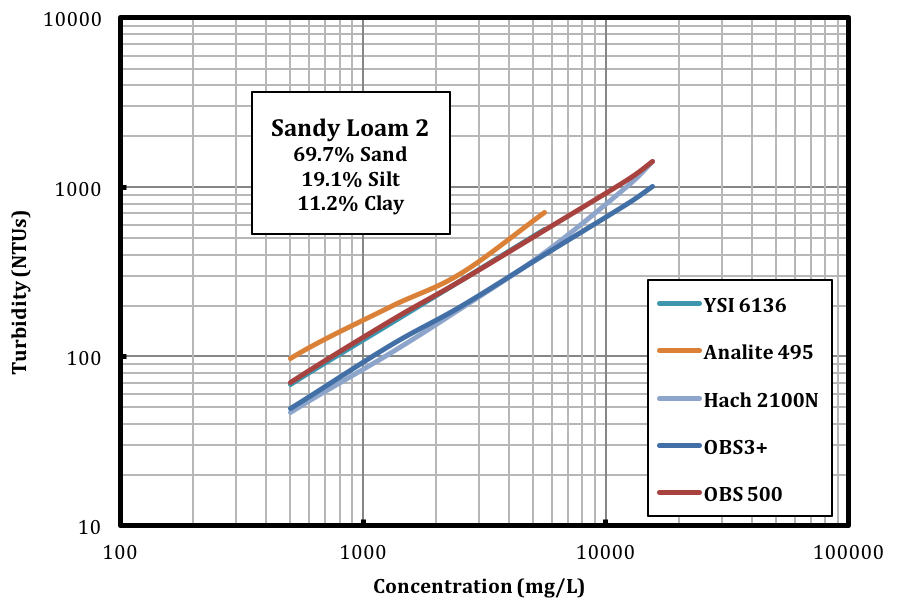
Figure 3 provides the turbidity values generated by each sensor for one soil type. In general, the sensors differed by (approximately) a given percentage for each type of soil tested. Differences in wave length, detection angles, and method used, back scatter versus side scatter, can explain the range of turbidities recorded from different sensors for the same soil (Anderson 2005). The 2100N and OBS3+ measured the lowest turbidity values per soil type and the Analite NEP495 recorded the highest turbidity for each soil. The percent sand, percent silt and percent clay correspond to the primary particle sizes.
Figure 3. Turbidity values measured by each sensor on the sandy loam 2 soil.
An average value of the difference between the 2100N and all the sensors for each soil type and the average value for all the soil textures by individual sensors was calculated. The results at a concentration of 2500 mg/L are shown in Table 3.
Table 3. The value of the difference between the Hach 2100N bench top turbidity sensor and all the field sensors at suspended solids concentration of 2500 mg/L for each soil type and the average value for each sensor for all the soils.
| Difference in NTUs between 2100N and all sensors at a concentration of 2500 mg/L | ||||||
|---|---|---|---|---|---|---|
| Sensor | Sandy Loam | Sandy Loam 2 | Loam | Silt | Silty Clay Loam | Average |
| OBS 3+ | 12 | 5 | 14 | 36 | 23 | 18 |
| OBS 500 | 73 | 84 | 110 | 113 | 160 | 108 |
| YSI 6136 | 91 | 85 | 77 | 118 | 190 | 112 |
| Analite 495 | 92 | 115 | 220 | 188 | 195 | 162 |
| Average | 67 | 72 | 105 | 113 | 142 | |
Both differences in soil texture and probe configuration had an impact on accuracy of turbidity readings. When compared against turbidity values given by the 2100N at a concentration of 2500 mg/L, differences in turbidity due to changing soil textures ranged from 60 to 142 NTUs. Differences in probe configurations generated a range of average turbidities between 18 and 162 NTUs. The average difference between the Hach 2100N bench top (our assumed baseline) and the Campbell Sci. OBS 3+ sensor turbidities was the least of the four sensors at 18 NTU’s. This difference was compared to 108 NTUs for the Campbell Sci. OBS500, 112 NTUs for the YSI 6136 and 162 NTUs for the McVan Analite NEP495.
More information on this topic can be found in the research report, “Development and Evaluation of Effective Turbidity Monitoring Methods for Construction Projects,” at http://www.cts.umn.edu/Publications/ResearchReports/reportdetail.html?id=2374
References
- Anderson, C. W. (2005). Turbidity. U.S. Geological Survey techniques of water-resources Investigations (A6.6). Retrieved from water.usgs.gov
- Lewis, Jack (2007). Comparisons of turbidity data collected with different instruments. Report on a cooperative agreement between the California Department of Forestry and Fire Protection and USDA Forest Service--Pacific Southwest Research Station (PSW Agreement # 06-CO-11272133-041). http://www.fs.fed.us/psw/topics/water/tts/Tprobe final report.pdf
- U.S. EPA (2011) Industry effluent guidelines: Construction and development. United States Environmental Protection Agency. Retrieved from https://www.epa.gov/eg/construction-and-development-effluent-guidelines


