UPDATES: February 2021

UPDATES is an email newsletter on stormwater management, assessment (including monitoring), and maintenance research at St. Anthony Falls Laboratory and the University of Minnesota.
Optimizing Biofiltration Media for Phosphate Release, Filtration Rates, and Vegetation Growth
February 2021 (volume 16 - issue 1)
Contributed by Andy Erickson; St. Anthony Falls Laboratory, University of Minnesota. Project Team Members include Jessica L. Kozarek1, Kathryn A. Kramarczuk1, Laura Lewis2, Barbara Heitkamp1, John Chapman3, Mike Isensee4, Mike Trojan5, David Fairbairn5, and Erin Anderson Wenz6
1St. Anthony Falls Laboratory, University of Minnesota
2Department of Civil, Environmental, and Geo-Engineering, University of Minnesota
3Biosystems and Bioproducts Engineering, University of Minnesota
4Carnelian-Marine-St. Croix Watershed District
5Minnesota Pollution Control Agency (MPCA)
6Barr Engineering Company
This article was developed from the full report by Erickson, AJ, Kozarek, JL, Kramarczuk, KA, and Lewis, L. (2021). “Biofiltration Media Optimization – Phase 1 Final Report.” Project Report No. 593, St. Anthony Falls Laboratory, University of Minnesota, Minneapolis, MN. January 2021. Retrieved from the University of Minnesota Digital Conservancy, https://hdl.handle.net/11299/218193
Introduction
Biofiltration has become common in Minnesota’s urban landscape because it is one of the most robust stormwater treatment practices available to designers. Stormwater professionals and practitioners, however, still face challenging decisions while designing these practices and often feel as if they are guessing when selecting media components and designing these practices. In particular, the most commonly used and recommended biofiltration media mixes have been shown to export phosphate, potentially contributing to water quality impairments. This increases environmental risk and uncertainty when attempting to implement Total Maximum Daily Load recommendations. Our objectives of this research are to 1) identify which local and sustainable biofiltration media are effective for filtration rate and supporting plant growth and microbial function, while not releasing phosphate, and 2) document local sources, simple tests or metrics, and/or design specifications that can be used by practitioners to reliably and repeatably obtain a biofiltration practice that functions as expected. In other words, we intend to partially fill the knowledge gap of the best available biofiltration media components that can be locally sourced in Minnesota and accurately specified. This knowledge will hopefully empower practitioners to design biofiltration practices with the best available knowledge and understanding of media components in Minnesota.
Thirty mesocosms of various biofiltration media mixes were constructed in the outdoor spillway adjacent to St. Anthony Falls Laboratory's Outdoor StreamLab to evaluate the impact of media components on filtration rate, nutrient output, and vegetation growth during one rainy season, as follows (three replicates of each):
- 100% clean washed concrete sand (baseline control)
- 10% food residue compost + 90% clean washed sand,
- 20% food residue compost + 80% clean washed sand,
- 10% leaf compost + 90% clean washed sand,
- 20% leaf compost + 80% clean washed sand,
- 15% biochar + 20% leaf compost + 65% clean washed sand,
- 5% spent lime + 20% leaf compost + 75% clean washed sand,
- 5% iron + 20% leaf compost + 75% clean washed sand,
- 20% sphagnum peat + 80% clean washed sand, and
- 20% reed sedge peat + 80% clean washed sand.
Fourteen rainfall events were simulated with approximately five gallons of phosphorus-enhanced water during summer and fall 2019. Flow rate through the mesocosms was measured and samples of the influent and effluent water were tested for nitrate and phosphate. In between events, settling, vegetation growth, and rainfall movement through each mesocosm were also monitored. The literature review, methods, results, and discussion are described in the full report (Erickson et al. 2021).
Objective #1: Filtration Rate
The filtration rate was measured as the flow rate (volume per time) through the outdoor mesocosms. All media mixes passed 50% of the influent volume within 5 – 15 minutes, and 80% – 98% of influent volume passed through all media mixes at 120 minutes after the start the experiments, as shown in Figure 1. Flow through all media mixes was similar except for a few isolated ponding events in the reed sedge mixture. Iron media allowed water to pass through faster than 100% sand, but otherwise all media were statistically similar to each other and to 100% sand. Based on these results, there is no clear evidence that any of these mixtures have a major advantage or disadvantage for filtration rate within the first year of use. Further testing in subsequent years will elucidate if these patterns change as the mixtures age.
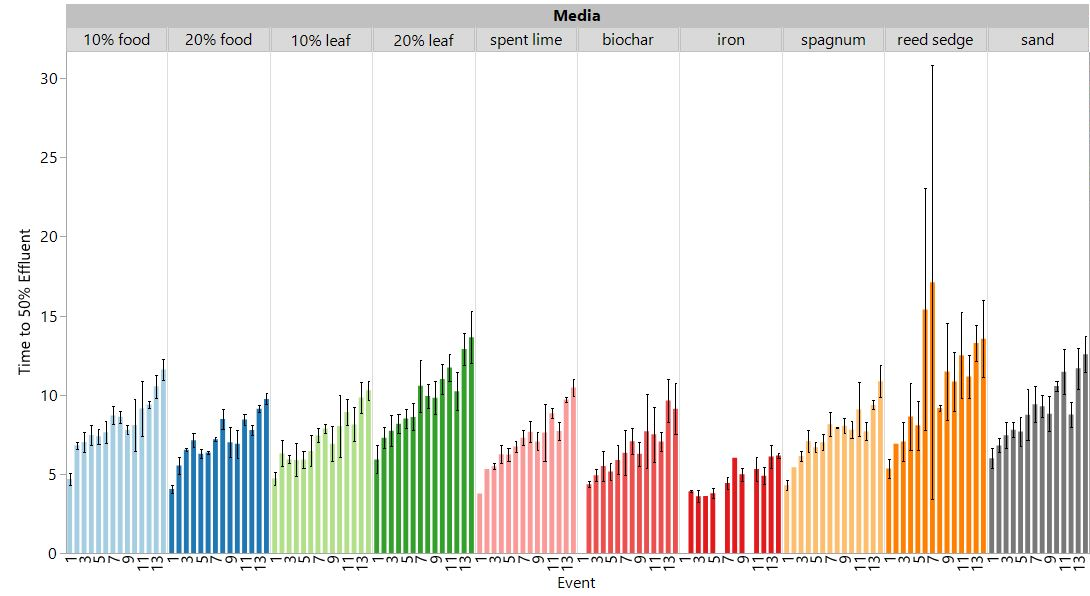
Figure 1: Time (minutes) to 50% effluent by media mix treatment over simulated stormwater events. Missing data indicates that the time to 50% effluent was less than the initial recording time.
Objective #2: Supporting Vegetation Growth
While the vegetation growth varied between media mixes, vegetation reached maximum height approximately 50 days after seeding (see Figure 2). Spent lime mix had the tallest vegetation and most biomass (not shown), which were statistically greater than 100% sand. The compost-amended mixes (leaf compost, food compost, biochar, and spent lime), with the exception of iron, had more vegetation biomass than the peat and sand media mixes, though the differences were not statistically significant due to large variation (not shown) in vegetation height and biomass among mesocosms. Note that one of the 20% leaf compost mesocosms did not grow any vegetation, which was excluded from all vegetation height and biomass analysis as an outlier. The iron media mixes produced statistically similar vegetation biomass as the 100% sand, which suggests that adding iron limits the vegetation support provided by compost when iron and compost are mixed together.
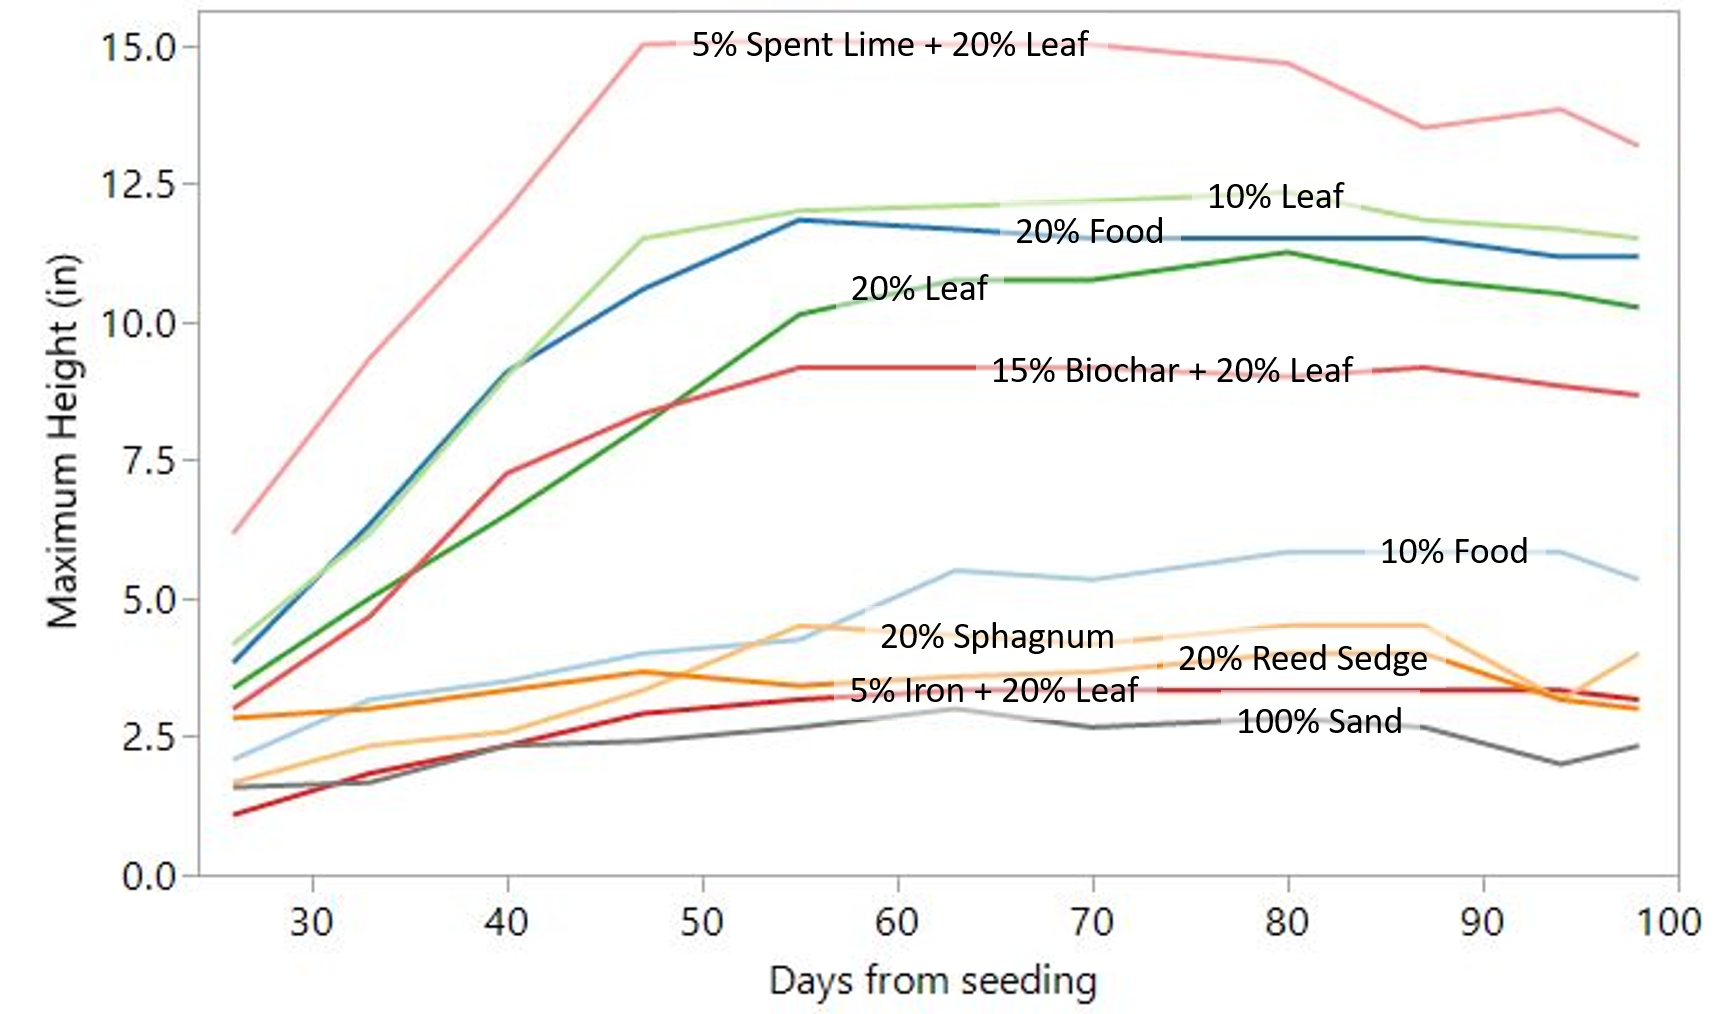
Figure 2: Maximum switchgrass height (average of three replicates) for each media mix, excluding data from mesocosm 1 (20% leaf compost with no vegetation growth).
Objective #3: Limiting Phosphate Release
Phosphate was measured in the effluent after every simulated stormwater event (Figure 3). The effluent phosphate concentration from 10% and 20% food compost, 10% and 20% leaf compost, biochar, and spent lime media mix treatments were significantly larger than the inflow (tank). More compost (20% vs. 10%) increased the effluent phosphate concentration. Leaf-based compost also produced a larger effluent phosphate concentration compared to food residue compost. The effluent phosphate concentration from biochar and spent lime (both mixed with 20% leaf compost) was less than the phosphate concentration from 20% leaf compost alone but larger than the influent and 100% sand, suggesting that biochar and spent lime captured some but not all of the phosphate released from leaf compost.
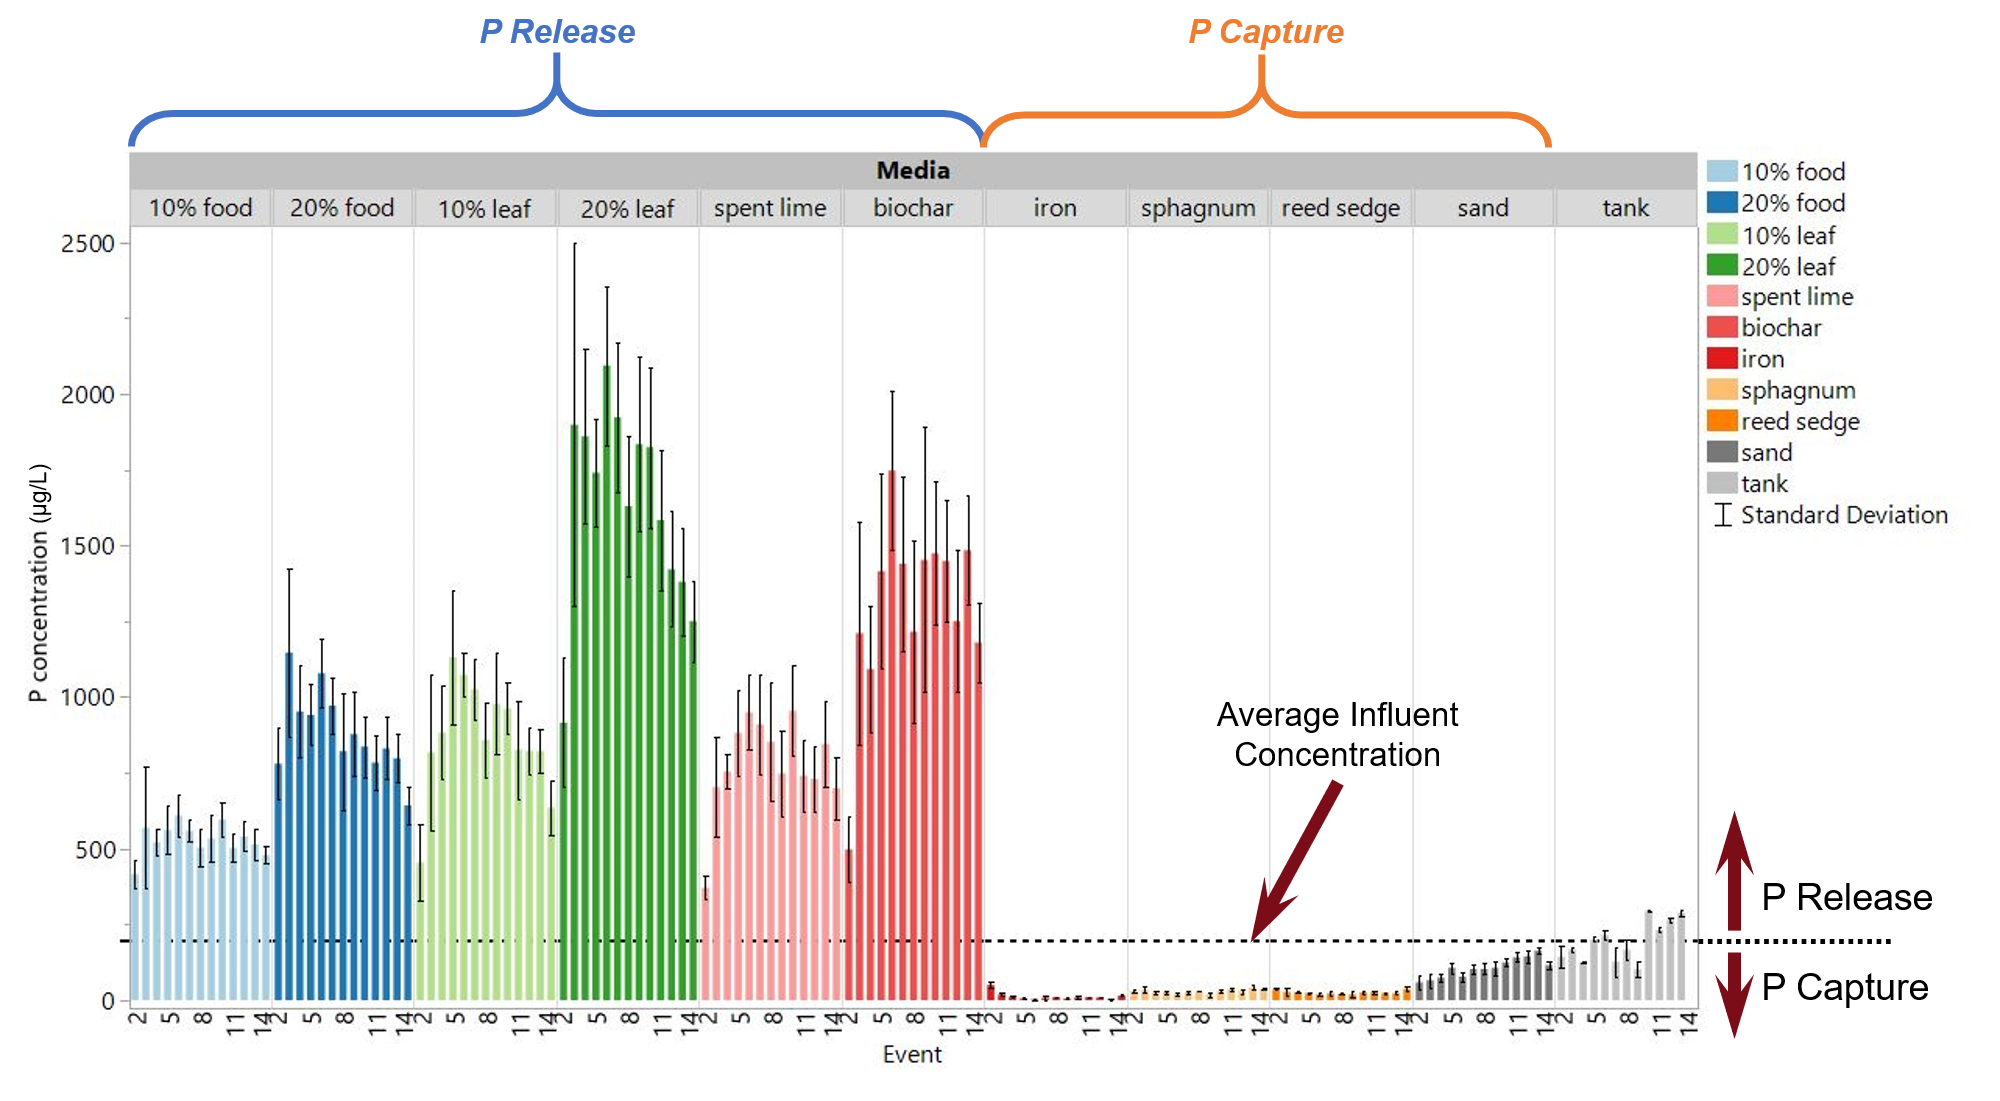
Figure 3: Phosphate as P concentration (µg/L) in effluent across events by media mix treatments and influent (tank). Dashed line indicates the average of the influent concentrations (197 µg/L).
In contrast, the effluent phosphate concentration from the iron, peat mixes (reed sedge and sphagnum), and 100% sand media mixes was statistically less than the influent tank (tank average = 197 µg/L), as shown in Figure 4. Compared to the tank phosphate concentration (average = 197 µg/L), the iron media mix captured phosphate from the influent and phosphate released from the 20% compost (20% leaf compost average = 1643 µg/L; see Figure 3) and reduced the phosphate concentration down to 13 µg/L, on average. The sphagnum and reed-sedge peats (30 µg/L and 26 µg/L phosphate, respectively) also captured phosphate from the influent.
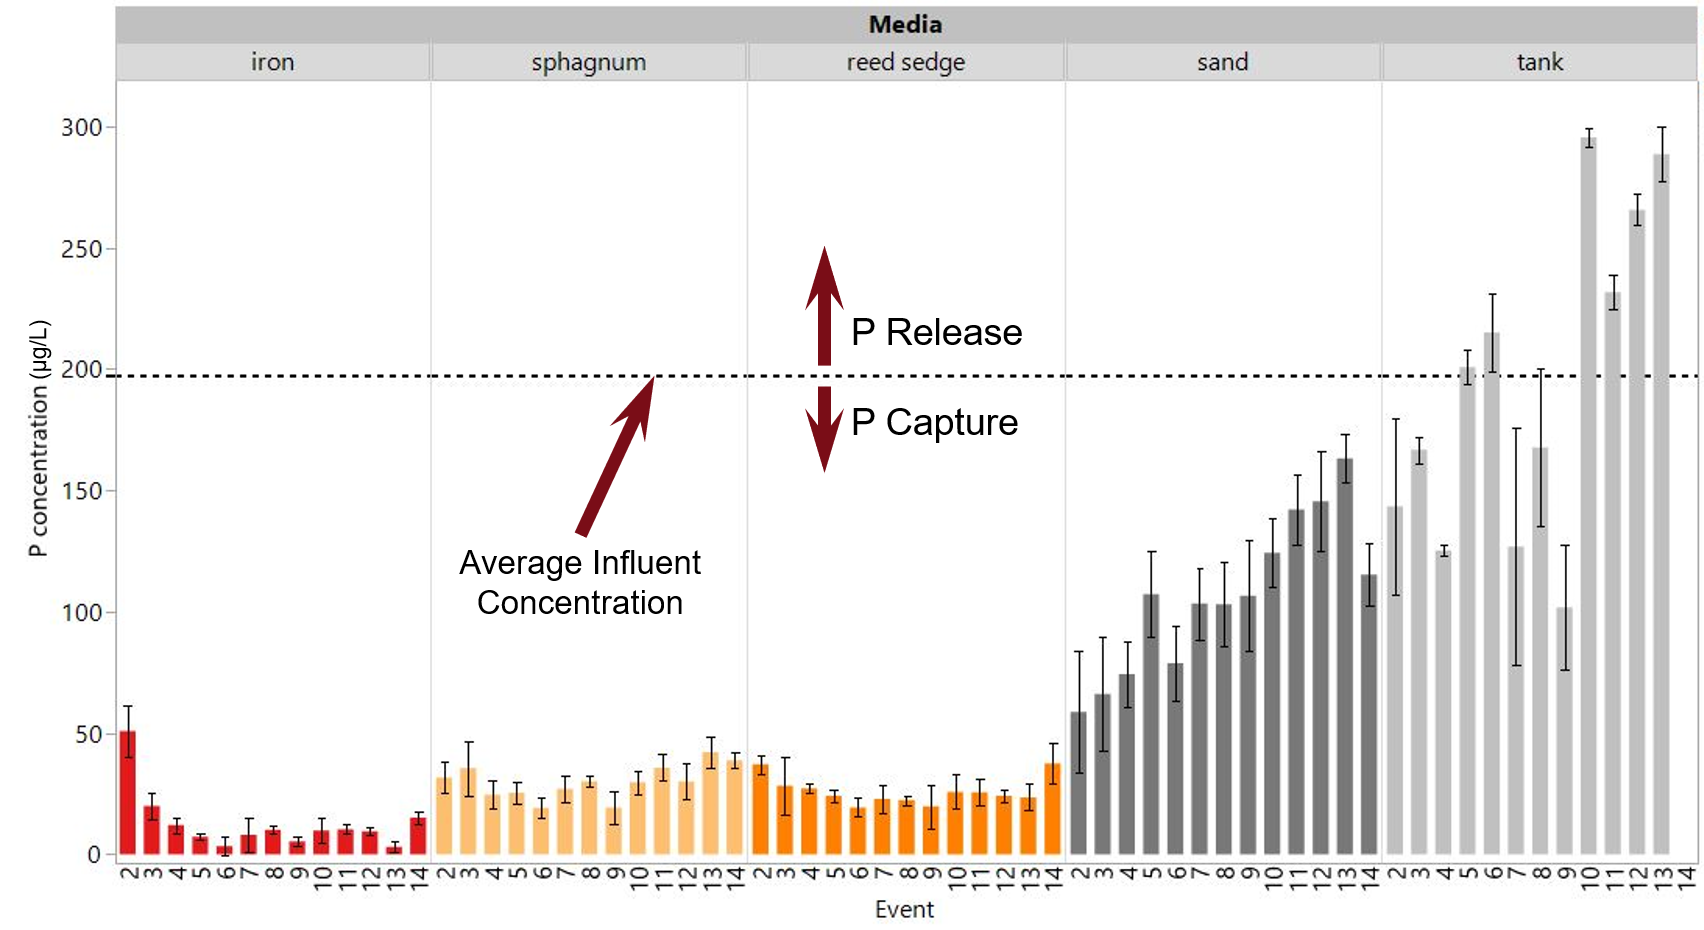
Figure 4: Phosphate as P concentration (µg/L) in effluent for iron, sphagnum peat, reed-sedge peat, 100% sand, and influent (tank). Dashed line indicates the average of the influent concentrations (197 µg/L).
Cost Comparisons
It is important to consider the cost of materials when comparing media mixes. Material costs vary by location and over time and delivery costs will also vary by location and supplier. Because actual values will not be relevant beyond the publication date of this report, a relative cost was computed using the 100% sand media as the baseline cost. Thus, Relative cost = Cost of Media Mix / Cost of 100% Sand. The costs of the media used in this study were provided by a personal communication quote (Plaisted Companies, 2021) from a local Twin Cities Metropolitan Area (TCMA) supplier and used to compute the relative cost of the media mixes:
- 100% Sand: Relative Cost = 1
- 90% Sand + 10% Leaf Compost: Relative Cost = 1.6
- 80% Sand + 20% Leaf Compost: Relative Cost = 1.7
- 90% Sand + 10% Food Compost: Relative Cost = 2.1
- 80% Sand + 20% Food Compost: Relative Cost = 2.5
- 80% Sand + 20% Sphagnum Peat: Relative Cost = 2.1
- 80% Sand + 20% Reed Sedge Peat: Relative Cost = 2.3
- 75% Sand + 20% Leaf Compost + 5% Spent Lime: Relative Cost = 2.6
- 65% Sand + 20% Leaf Compost + 15% Biochar: Relative Cost = 6.8
- 75% Sand + 20% Leaf Compost + 5% Iron: Relative Cost = 14.2
Key Takeaways
- Filtration rate in all the media mixes were similar.
- Both leaf and food residue composts in biofiltration practices increases vegetation growth but also increases phosphate concentration in the outflow. Leaf compost released more phosphate than food residue compost.
- Biochar and spent lime were added to compost-amended media, but the outflow phosphate concentration was greater than the inflow concentration (i.e., phosphate release). Vegetation growth was similar to compost alone, so biochar and spent lime provided little benefit when added to compost-amended media.
- Iron captured all phosphate released from compost as well as phosphate in the inflow, resulting in low outflow phosphate concentration (i.e., phosphate capture). Vegetation growth, however, was inhibited and similar to the vegetation growth in 100% sand.
- When compost is replaced with sphagnum or reed sedge peat, phosphate is captured, and vegetation growth is inhibited.
Future Research
Phase II for this research will continue the outdoor mesocosm experiments for three additional rainy seasons and reveal whether the filtration rate, nutrient release, and vegetation trends reported herein continue in subsequent years. Phase II will also investigate the impact of road salt application on media performance and expand vegetation research with a germination study of low-organic content (e.g., < 10% compost) media mixes.
Get the Full Report
This article was developed from the full report by Erickson, AJ, Kozarek, JL, Kramarczuk, KA, and Lewis, L. (2021). “Biofiltration Media Optimization – Phase 1 Final Report.” Project Report No. 593, St. Anthony Falls Laboratory, University of Minnesota, Minneapolis, MN. January 2021. Retrieved from the University of Minnesota Digital Conservancy, https://hdl.handle.net/11299/218193
Acknowledgements
This project was supported by the Minnesota Stormwater Research and Technology Transfer Program administered by the University of Minnesota Water Resources Center through an appropriation from the Clean Water Fund established by Minnesota Clean Water Land and Legacy Amendment and from the Minnesota Stormwater Research Council with financial contributions from:
- Capitol Region Watershed District
- Comfort Lake-Forest Lake Watershed District
- Mississippi Watershed Management Organization
- Nine Mile Creek Watershed District
- Ramsey-Washington Metro Watershed District
- South Washington Watershed District
- City of Edina
- City of Minnetonka
- City of Woodbury, and
- Wenck Associates
- Minnesota Cities Stormwater Coalition
For more information about the Center and the Council, visit: https://www.wrc.umn.edu/projects/storm-waste-water
For more information about the Minnesota Clean Water, Land and Legacy Amendment, visit: https://www.legacy.mn.gov/about-funds
Any opinions, findings, conclusions, or recommendations expressed in this publication are those of the author(s) and do not necessarily reflect the view of the Water Resources Center or the Minnesota Stormwater Research Council.