UPDATES: April 2018
Urban Stormwater Ponds can be a Source of Phosphorus
April 2018 (volume 13 - issue 2)
Contributed by Vinicius J. Taguchi, Ph.D. Student; Tyler A. Olsen, M.S.; Poornima Natarajan, Ph.D., Research Associate; Benjamin D. Janke, Ph.D., Research Associate; Jacques C. Finlay, Ph.D., Professor, Department of Ecology, Evolution, and Behavior, University of Minnesota; Heinz G. Stefan, Ph. D. Professor Emeritus and John S. Gulliver, Ph.D., Professor, Department of Civil, Environmental, and Geo- Engineering, University of Minnesota; and Claire S. Bleser, Ph.D., District Administrator, Riley Purgatory Bluff Creek Watershed District.
Funded by the Minnesota Pollution Control Agency.
Introduction
Although Minnesotans will proudly tell you that there are more than 10,000 lakes in their state, not everyone knows that there are also more than 30,000 stormwater ponds in Minnesota (Olsen 2017). Stormwater (wet retention) ponds reduce the peak flow of a flashy urban hydrograph, as well as settle out suspended solids containing nutrients and pollutants. For inland waters, the primary management target for removal is the particulate form of phosphorus (P) because phosphorus is often the limiting nutrient in fresh waters and therefore the main cause of eutrophication and algae blooms in our lakes and streams. In this article, we describe research on how common phosphorus release from ponds is and how it occurs.
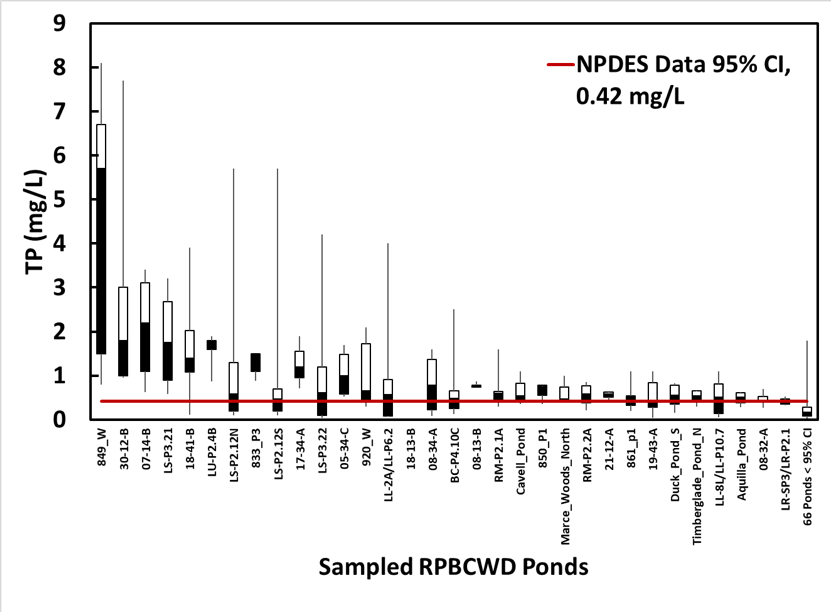
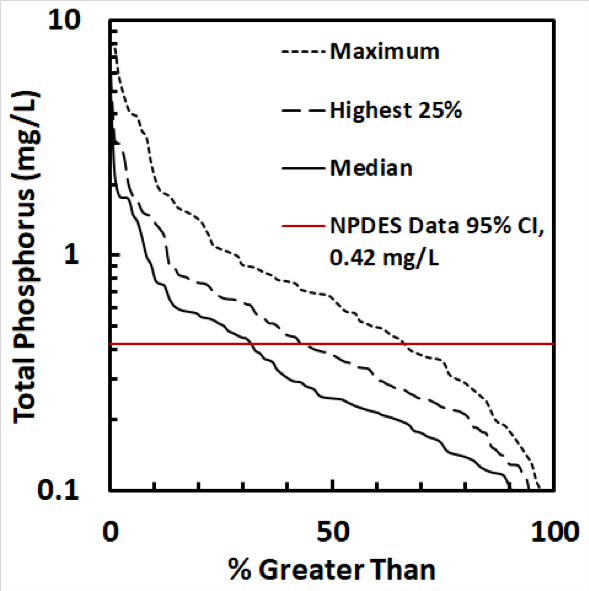
There is evidence that aging stormwater ponds can become net sources of phosphorus to receiving waters during high flow events. For example, the total phosphorus (TP) concentration in the pond should be equal to or less than the typical inflow TP concentration (due to settling). To evaluate this, we examined data from the Riley Purgatory Bluff Creek Watershed District (RPBCWD) in Minnesota. Between 2010 and 2012, the RPBCWD surveyed 98 ponds and observed high TP concentrations in a number of them (Forster et al. 2012; RPBCWD 2014). In order to evaluate how likely these high TP concentrations were to have been caused by incoming stormwater runoff, urban stormwater runoff characterization data from the US EPA National Pollutant Discharge Elimination System National Stormwater Quality Database (Pitt et al. 2008) was fit to a log-normal distribution. The upper 95% confidence interval (95% CI), which represents the maximum value for 97.5% of the distribution, was then calculated to be 0.42 mg/L. Thus, 97.5% of the inflow data are estimated to be below 0.42 mg/L. We compared this concentration against sampling data from RPBCWD in Figure 1, which shows box plots for each of the 32 ponds with median TP concentration above the 95% CI and condenses the remaining 66 ponds into a single box plot. This analysis shows that 32% of the 98 ponds sampled had median TP concentrations greater than the 95% CI of the NPDES data (Figure 2). Our hypothesis is that these ponds have high internal P loading from the sediments, released as orthophosphorus (ortho-P or PO4-3), and are therefore more likely to experience high P concentrations. We set out to address this hypothesis through the laboratory column studies and field measurements described below.
Figure 1. RPBCWD TP grab sample box plots. The 66 ponds with a median below 0.42 mg/L are combined into the far right box plot.
Figure 2. Summary of RPBCWD pond data distribution of total phosphorus concentration presented in Figure 1.
Sediment Cores
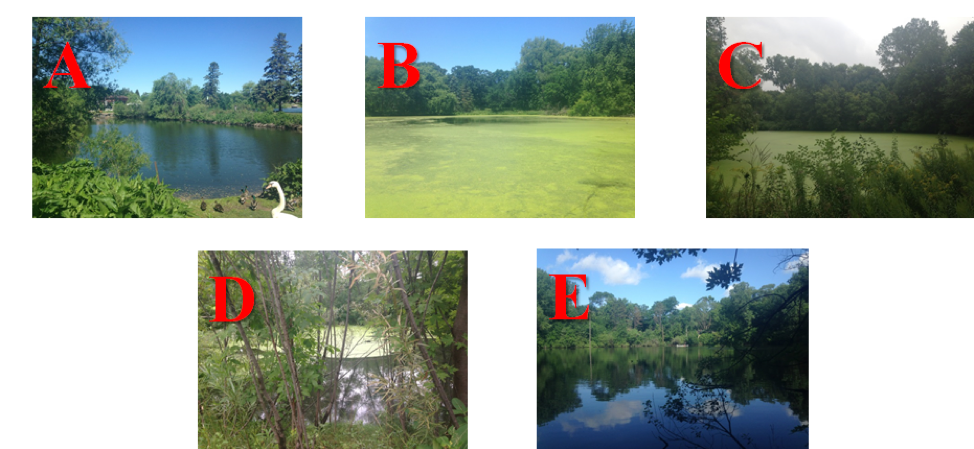
In order to address our hypothesis that P release from the sediments could be the cause of high P concentrations in stormwater ponds, we needed to identify and better understand the mechanisms controlling P release from stormwater pond sediments. We first extracted 5-6 intact sediment cores with overlying pond water, into polycarbonate liner tubes (~7 cm outer diameter), from each of five stormwater ponds (Figure 3) that are believed to be releasing sediment phosphorus.
Figure 3. Stormwater pond field sites. Pond A is in St. Cloud, Pond B is in Minnetonka, and Ponds C, D, and E are in Roseville.
Each core was incubated at the St. Anthony Falls Laboratory with more than 30 cm of sediment and roughly a meter of pond water above the sediment (Figure 4). First, the overlying water was drained and filtered through a 1.2 μm glass fiber filter to remove suspended particulates. The filtered water was then added back to the respective core with care taken to avoid sediment resuspension. The cores were subjected to phases of treatments, during which time ortho-P and total phosphorus (TP), dissolved oxygen (DO), temperature, and pH were all monitored. The water columns were then bubbled with air to simulate the mixing and aeration that takes place in spring. Afterward, air bubbling was halted and cores were left unmixed for one month. An overall sediment P flux rate was calculated from the water column P concentrations measured over the 14-day monitoring period. At the conclusion of the monitoring period for each sediment-water core, a sequential extraction of the sediment phosphorus was performed to illustrate differences in P speciation among ponds (Engstrom 2010).
Figure 4. Intact sediment and water cores taken from Pond B.
Sediment Core Results
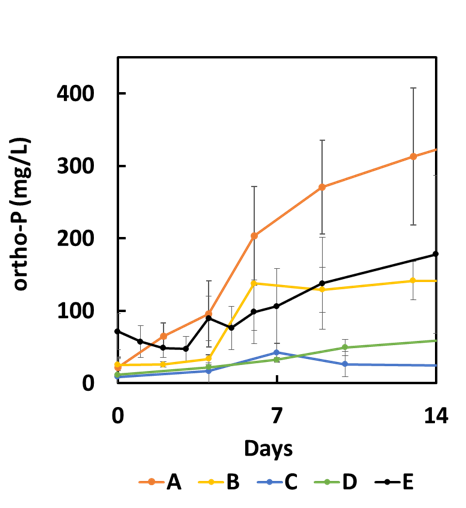
All of the pond sediments released ortho-P under low DO conditions (< 0.5 mg/L) , as shown in Table 1 and Figure 5). By contrast, ortho-P release was negligible under high DO conditions (not shown). We used the calculated P flux rates for each pond to approximate the potential impact on the overall TP concentration in the pond (Table 1). We assumed that the impact on the TP concentration of the pond (mg/L) is a function of the ortho-P release rate (mg/m2 /day), the duration over which ortho-P release is believed to be occurring (days in season), and the mean depth of the pond (m). Ponds C and D had a relatively low release rate that would have a fairly minor impact upon TP concentration. Ponds A, B, and E, however, had a high release rate that could have a substantial impact on TP concentration under low DO conditions. We began to investigate the differences between these ponds.
Table 1. Impact on anoxic pond phosphorus concentration calculations for 26 cores taken from 5 ponds (P-Flux ± 67% CI of the mean value).
| Pond - |
Organic Matter Content* | P-Flux** (mg/m2/day) |
Mean Depth (m) |
Days in Season | Impact on P (mg/L) |
| A | 30% | 7.51 ± 2.93 | 0.7 | 180 | 1.8 |
| B | 86% | 5.62 ± 1.80 | 1.0 | 180 | 1.1 |
| C | 15% | 1.09 ± 0.26 | 2.0 | 180 | 0.1 |
| D | 16% | 2.27 ± 0.49 | 1.2 | 180 | 0.3 |
| E | 27% | 3.18 ± 2.76 | 1.2 | 180 | 0.5 |
*Averages for top 11 cm
**Averages for first 2 weeks
Figure 5. Orthophosphate concentration in water above the sediment cores under low DO conditions (Error bars = 67% confidence interval of the mean). The increase in concentration over time is due to P release from the sediments.
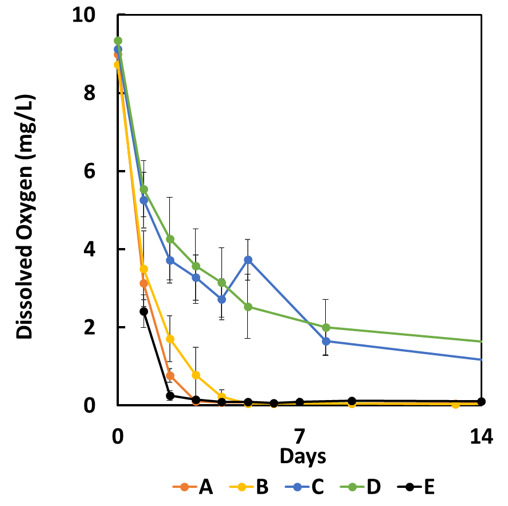
We noticed that the organic matter content in Table 1 and the initial oxygen consumption rates (due to microbial activity) following the cessation of air bubbling at the start of the monitoring period were much lower for Ponds C and D (Figure 6), suggesting that differences in P release rates could be due to differences in microbial activity in the sediments. We then tried a more detailed investigation of phosphorus speciation in the sediments.
Figure 6. Dissolved oxygen concentration change at 8 cm above the sediment in the pond cores (Error bars = 67% CI of the mean).
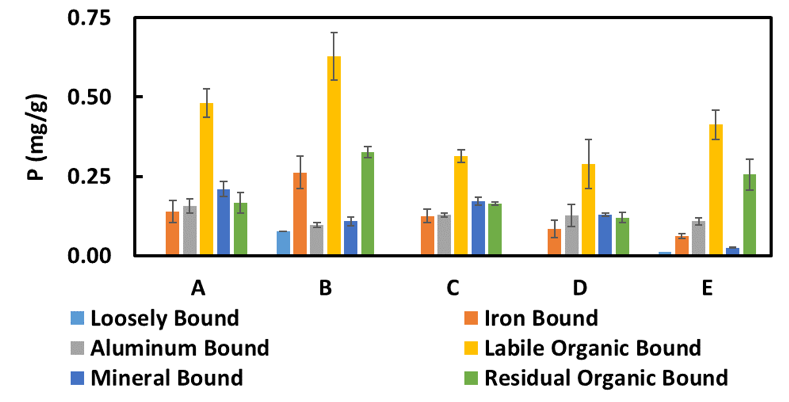
Extracting P sequentially from different fractions in the top 4 cm of sediments from each sediment-water core revealed that organic phosphorus may play an important role in urban stormwater pond systems (Figure 7). Loosely-bound, iron-bound, and labile organic bound P are all considered to be relatively mobile and therefore play the largest role with respect to P dynamics in the system. We found that sediment in the ponds was dominated by labile organic bound P, as opposed to lakes where loosely-bound and iron-bound P tend to be more important. The lower labile organic bound P content and lower release rates in Ponds C and D suggest that labile organic bound P may participate in the release of ortho-P from the sediments. More ponds would need to be sampled, however, before any correlation of sediment speciation to sediment release rate can be discerned.
Figure 7. Phosphorus speciation in core sediments (Error bars = 67% CI of the mean). Loosely-bound P is assumed to be primarily dissolved, iron-bound P is redox sensitive, labile organic bound P can be degraded over time to become ortho-P, mineral-bound and aluminum-bound P are considered to be redox-insensitive, and residual organic bound P is assumed to be non-degradable.
Field Measurements of Pond Conditions
Concurrent with the sediment-water core experiments, three of the stormwater ponds have also been monitored continuously in-situ to inform the laboratory core study with the actual physico- and bio- chemical conditions affecting each pond. Periodic water samples and vertical profiles of chemistry (temperature, dissolved oxygen, and specific conductance) were collected at the center of the ponds during an entire year, including winter. Loading of water and phosphorus (dissolved and particulate) into and out of the ponds were quantified through continuous discharge measurements and automatic sampling of inflows and outflows. These latter measurements are still under analysis, but the profiles provided some interesting results.
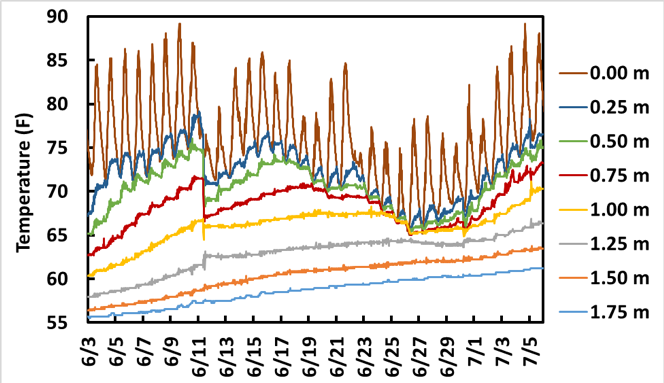
Strong stratification in the 3 ponds prevented diurnal variations in temperature from affecting more than the near-surface water, so no overnight mixing was evident (Figure 8). Even moderate stormwater inflows did not result in complete mixing; for example, sharp temperature shifts on 6/11 from a 1-inch storm event (Figure 8) show evidence of partial mixing down to roughly 1.25 m below the pond surface, leaving the bottom ~0.75 m of the pond un-mixed (max depth = 2.0 m).
Figure 8. Temperature profiles for Pond E. Temperature gauge elevations are fixed and distances represent the distance below the uppermost probe rather than the distance below the water surface. The probe at 0 m likely protruded above the water, recording air temperature.
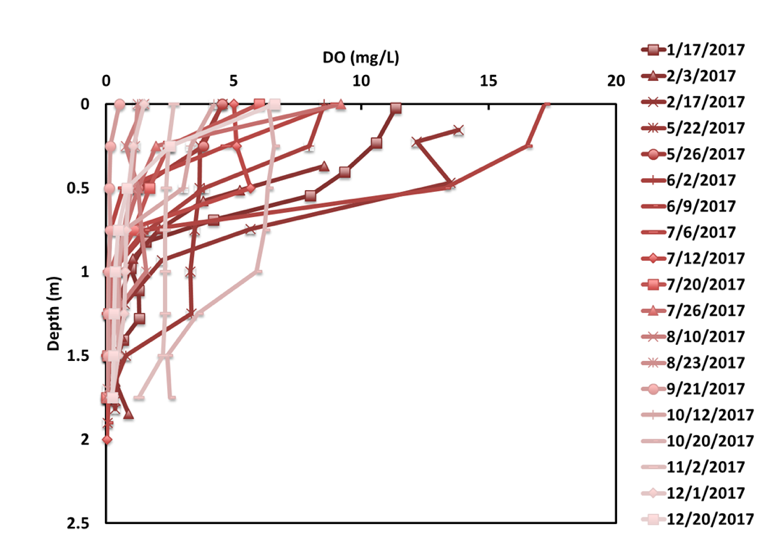
Stratification during the summer with turnover and mixing in the fall and spring are normal in large lakes, but small ponds were thought to turn over diurnally or at least during large storm events. Instead, regular manual temperature profiles throughout 2017 revealed evidence of stratification throughout most of the year, with DO concentration below 0.5 mg/L at the bottom sediment surface except for 10/20 and 11/2, following a nearly 3-inch storm event on 10/2/17 (Figure 9).
Figure 9. DO profiles for Pond E. At the bottom of the pond, DO concentration was typically less than 1 mg/L.
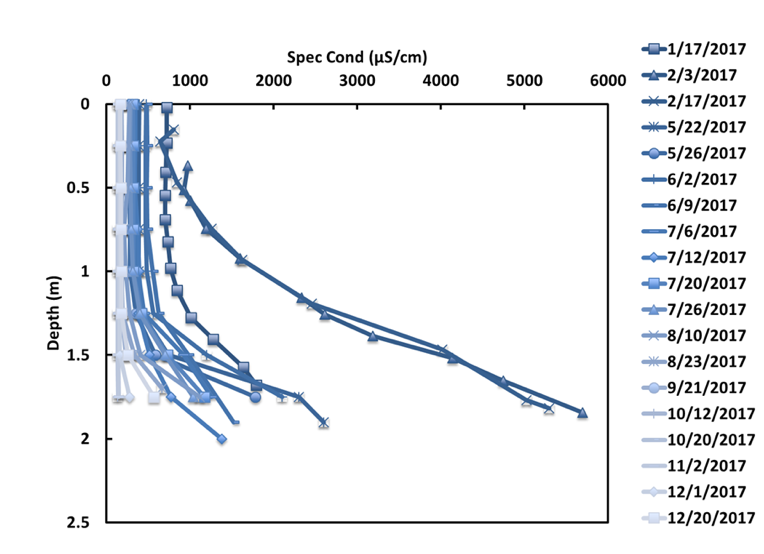
Chemostratification was present throughout much of the year at two of the three ponds monitored, where persistently high conductivity levels at the pond bottoms were attributed to chlorides from road salt, which makes water heavier and more resistant to vertical mixing (Novotny et al. 2009). This stratification peaked in February and slowly weakened over the open-water season (likely by diffusion and some entrainment by inflows) until October, when the pond appears to have been flushed out by a nearly 3-inch storm event after turning over in mid-September (Figure 10). By December, the pond was already beginning to re-stratify. This October – December period without chemostratification is the only time when DO concentrations at the sediment surface were above 0.5 mg/L. Thus, in addition to affecting our lakes and streams, chloride is also affecting the temperature and oxygen dynamics of stormwater ponds. The impact of this low DO concentration is that the anoxic conditions favorable for ortho-P release from pond sediments were present throughout the spring and summer. The release rates from the laboratory sediment-water column study would be applicable during this period, potentially allowing for interpretation of observed P concentrations in the ponds.
Figure 10. Specific conductivity profiles for Pond E. High conductivity at the bottom of the pond is attributed to chloride stratification.
Conclusions
Phosphorus concentration is unusually high in roughly 1/3 of urban stormwater ponds, indicating that they are not performing as designed. Rather than capturing P, these ponds seem to be releasing P and polluting downstream waters. We believe the reason is the sediments are releasing ortho-P to the water column, a process known as internal loading. Phosphorus release from the sediments of ponds may be facilitated by low DO concentration. It appears that many ponds in the Twin Cities Metropolitan Area are stratified through most of the summer by accumulation of road salt in winter and spring snowmelt, therefore leading to low DO concentration that promotes internal loading. Sediment-water phosphorus flux was determined from five ponds, and three were determined to be high. Two were not as high, however, due to a lower microbial activity in the sediment as indicated by sediment oxygen demand. TP grab samples can identify the likelihood that P is being released from pond sediments through the use of historical runoff concentrations (Figure 1). This issue is believed to be more widespread than previously considered, and studies to easily identify, quantify, and remediate the release of P are on-going.
Acknowledgements
Laboratory analyses facilitated by Peter Corkery and Rikita Patel. Field sampling assisted by Krysta Garayt, Claire Jaeger Mountain, and Peter Corkery. Project funding provided by the Minnesota Pollution Control Agency. First author education funded by National Science Foundation grant 00039202. Research guidance provided by Dr. Heinz Stefan. Field work supported by LacCore. The Cities of Bloomington, Chanhassen, Eden Prairie and Minnetonka for helping monitor the stormwater ponds in the Riley Purgatory Bluff Creek Watershed District. Data provided by RPBCWD was analyzed by David Austin, Jason Carroll, and Roger Scharf of CH2M (now Jacobs) from 2010-2012. Research performed using facilities and resources of the Department of Civil, Environmental, and Geo- Engineering, the Department of Ecology, Evolution, and Behavior, and the St. Anthony Falls Laboratory of the University of Minnesota – Twin Cities.
References
- Engstrom, D. (2010). Sediment phosphorus extraction procedure high sample through-put. Modified by Robert Dietz and Michelle Natarajan (2015).
- Forster, P., Austin, D., Scharf, R., Carroll, J., and Enochs, M. (2012). Rethinking Stormwater Pond Nutrient Removal. Oral Presentation at the 2012 Minnesota Water Resources Conference. St. Paul, MN.
- Natarajan, P., Gulliver, J. S., and Arnold, W. A. (2017). Internal Phosphorus Load Reduction with Iron Filings. US Environmental Protection Agency (EPA) Section 319 Program and Minnesota Pollution Control Agency (MPCA).
- Novotny, E. V., Sander, A. R., Mohseni, O., and Stefan, H. G. (2009). Chloride ion transport and mass balance in a metropolitan area using road salt. Water Resources Research, 45(12).
- Olsen, T. A. (2017). Phosphorus dynamics in stormwater ponds (master’s thesis). University of Minnesota – Twin Cities, Minneapolis, Minnesota.
- Pitt, R., Maestre, A., and Morquecho, R. (2008). “National Stormwater Quality Database (NSQD) Version 3 Spreadsheet.” US EPA National Pollutant Discharge Elimination System (NPDES).
- Riley Purgatory Bluff Creek Watershed District (RPBCWD). (2014). Stormwater Pond Project 2013 Report.
| UPDATES is an email newsletter on stormwater management, assessment (including monitoring), and maintenance research at St. Anthony Falls Laboratory and the University of Minnesota. |

